Rating Whole-Body Suspiciousness Factors in
Automated Surveillance of a Public Area
|
Neil C. Rowe1 and Alex L. Chan2
1Computer Science, U.S. Naval Postgraduate School, Monterey, CA, USA
2Sensors and Electron Devices Directorate, U.S. Army Research Laboratory, Adelphi, MD, USA
|
Abstract - We tested clues to automated detection of
suspicious behavior of pedestrians in image sequences of 71,236 images in 106
sequences, developed at the U.S. Army Research Laboratory for testing
surveillance systems.� We achieved a 66% success rate at identifying suspicious
behavior on infrared video and 64% on color video using just clues obtained
from the overall body motion without attempting to classify further what people
were doing.� We used seven clues including the norm of the acceleration vector
as measured at different granularities, atypicality of location, speed,
atypicality of the velocity vector with historical data, relative size of the
object, length of the track, and "contagion" from nearby suspicious
tracks.� The acceleration norm averaged over different time scales
significantly outperformed the other clues on the dataset, and our conclusion
is that it should be the primary focus of systems assessing suspicious behavior
in video.
Keywords: surveillance, video, suspicious, tracking,
acceleration
This paper appeared in the 2011 Intl. Conf. on Image
Processing, Computer Vision, and Pattern Recognition, Las Vegas, NV, July 2011.
1
Introduction
Detecting suspicious behavior in public spaces is essential
in combating crime and terrorism.� Manual surveillance is very tedious, and
human operators are prone to both false alarms and missed detections [1].�
Automated monitoring could reduce errors by alerting operators to only a few
highly suspicious circumstances [2].� Suspiciousness is not the same as
anomalousness, a topic that has been studied more thoroughly [3];
suspiciousness requires additional evidence of deceptiveness.� Recognizing
suspicious behaviors is simpler than general behavioral classification, and
specialized techniques can work well.� This work tested seven suspiciousness
factors of overall-body motions of people moving through a public area.� Limiting
ourselves to such motions invades privacy less than methods that analyze faces
and gestures [4], and such data can also be obtained from a variety of sensor
types.� This research examines surveillance by a single camera to minimize
costs, although more work can be done with multiple cameras [5].� A focus on
people and vehicles permits an emphasis on tracking in contrast to research on
background changes [6].
Earlier work of ours [7] used six features of observed paths
to estimate suspiciousness of path segments.� These were calculated as
nonlinear functions of path parameters and combined in a weighted average using
reasonable guesses as to the proper calculations.� Experiments were conducted
using a dataset of 39 image sequences taken on 14 different days in July
through November of public areas in different lighting and weather conditions.�
Five of these sequences included deliberately suspicious behavior enacted by
the experimenters, while the other 34 sequences depicted normal or �control�
behavior.� The average computed suspiciousness value for the paths in the 34
normal sequences was 0.51 with a standard deviation of 0.63, an average minimum
of 0.00, and an average maximum of 1.78.� The average suspiciousness of a path
segment in the normal sequences was 0.92 with a standard deviation of 0.27.� In
five sequences with deliberately suspicious behavior, the suspiciousness metric
was 1.16 for paths loitering behind bushes; 1.16 for meandering; 1.06 for
inconsistency in speed along a straight line; 1.12 for leaving a package on a
bench and speeding away; and 1.19 for waiting and then following another
person.
So suspicious activities did generate higher values of our
suspiciousness metric.� However, this level of accuracy caused significant
numbers of both false alarms and false negatives that would seriously annoy
typical human operators of such systems.� A reasonable question is whether our
approach can be refined by more systematic analysis of the problem to obtain
higher levels of accuracy.� One problem was that we had too little data, which
limited the ability of our algorithms to make good predictions.� Image
segmentation was also unreliable and problematic, which incurred many later
errors.� Also with so few experiments, we could not accurately assess the
relative importance of the suspiciousness factors to assign appropriate weights
to them.� Despite interesting recent work on the methodology for doing analysis
of surveillance video and assigning probabilities of suspicious behavior [8,
9], little work has actually been done to assess the relative values of the
suspiciousness factors.� We designed the experiments reported here to address
these challenges and answer some of the related questions.
2
Rating behavior for suspiciousness
To find suspicious behavior, we
look for signs of deception in atypicality, concealment, and goal switching,
the features suggested by the criminology literature.� Our previous work found
atypicality of position and velocity useful.� But atypicality of the
acceleration vector is more important, because it relates to forces through a Newton's Law, and thus reflects volition of the movers.� In fact, any nonzero acceleration
is interesting and potentially suspicious, not just anomalous accelerations.�
Sudden accelerations are key in detecting theft [10] and slow accelerations
occur in loitering (as changes in vector direction if not speed).�
Accelerations can be estimated at different granularities based on the time
gap, hence we need to define a range of approximations.� For an N-point path of
two-dimensional coordinates  , we calculate average acceleration
norm a(T) for integer time granularity T as:
, we calculate average acceleration
norm a(T) for integer time granularity T as:
�
T is most meaningful on a logarithmic scale, so an average of a(1),
a(2), a(4), a(8), etc., which are evenly spaced
logarithmically, provides a good metric of suspiciousness because this will
catch both theft-like quick movements with a(1) and loitering with a(8) and
a(16).
Apparent size
is a factor in suspiciousness because crime is more likely when the
perpetrators can conceal themselves [11].� In addition, people and objects can
be suspicious by association.� For example, when someone leaves a box beside a
car, the box is suspicious by its being novel (being not in the background) and
having an atypical zero acceleration for a long time; this should make the
person who left the box suspicious too.� In general, for each pair of paths
that are close, we calculate their contagiousness from one minus a sigmoid
function of the average of the minimum, mean and standard deviation of the
distance between their points at the same time, and weight suspiciousness of
the adjacent path by this contagiousness:

Here p is a particular path, s(p) is
the overall suspiciousness of a path, P is the number of paths, D is distance
in feet, and g is a sigmoid function of the form where  �is a scaling constant:

The inclusion of the distance
minimum will help find people leaving objects behind, the mean will help find
people walking together, and the standard deviation will help rule out people
moving inconsistently.� We did not use any social factors of suspiciousness
[12] since there was not much social interaction in our data, but such factors
could supplement ours in other public spaces.
Specifically for the experiments in this work, we defined
path suspiciousness for both pedestrians and vehicles as a weighted average of
seven factors: (1) infrequency of visitation (the reciprocal of the probability
of visit) of that location in the image; (2) atypicality of speed (degree to
which it was faster or slower than the average speed for all locations in the
given field of view); (3) atypicality of the velocity vector compared to
historical data near its location; (4) the norm of the acceleration vector a(T)
averaged over 0.2, 0.4, 0.8, 1.6, and 3.2 second time intervals; (5) fraction
of apparent concealment (1 minus the ratio of current size to the maximum size
of the region along its path); (6) shortness of the path defined as the
reciprocal of the number of frames in which the path is seen; and (7)
"contagion" through its association with other suspicious paths.� The
first four factors were adjusted by estimated distance from the camera, based
on fitting to person width in historical data.
The weights on the seven factors in our experiments were
empirically set to 0.04, 0.24, 0.08, 0.24, 0.16, 0.04, and 0.20 respectively,
based on preliminary experiments on the control dataset.� To make weighting
easier, following standard practice with artificial neural networks, the
sigmoid function g was used to convert the metrics into probabilities before
taking the weighted average.� For our experiments, the value of μ was 5 on
the bin count for factor (1); 5, 10, or 0.2 times the average speed in the
scene for factor (2) depending on whether it was a fast person, fast vehicle,
or something slow (inverse probability) respectively; 4 over the unweighted
average of the values for the different time scales for factor (3); 5 for
factor (4); the average height of objects in the scene at that location in the
control views for factor (5); 1 for factor (6); and 30 as shown for factor (7).
The weighted sum of the factors is the suspiciousness for
each path segment.� Paths are displayed to the user with a degree of redness
indicating the degree of suspiciousness, superimposed on the background view of
the surveillance area.� Figures 1 and 2 show examples of an infrared-camera
sequence and a color-camera sequence that both include some deliberately
suspicious behavior.� Figure 1 includes an unusual stop of a car, and Figure 2
includes loitering before
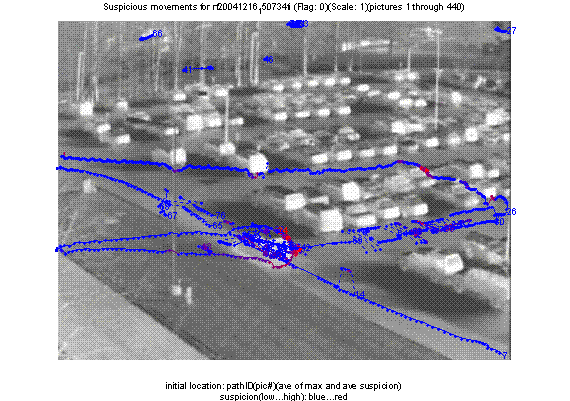
Figure 1: Suspiciousness analysis of an infrared video
sequence.
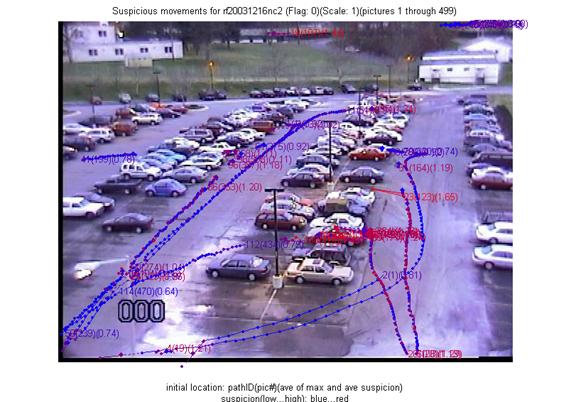
Figure 2: Suspiciousness analysis of a color
visible-light video sequence.
getting in cars and driving away.�
As an example of the ground-truth descriptions, the one for Figure 1 reads: �A
car pulls to the curb; another van comes and stops next to it for a while, both
vehicles leave afterward. Non-staged activities: 2 people and 1 car move in the
foreground.�
3
Image processing
We used mostly standard methods to track people and vehicles
[2], preferring region matching to particle filtering because there were few
moving regions.� We constructed a synthetic background image for each sequence
from nine images spaced through the sequence, finding the most typical color
for each pixel over the nine.� (For real-time use, the background image would
be constructed in advance.)� We subtracted each image from the background image
(with mean brightness of the new image matched to the mean brightness of the
background image) and segmented using a difference-magnitude threshold set by
training runs to yield 95% of the pixels of people in the images.� We merged regions
in vertical alignment to connect pieces of people when they were wearing
different colors of clothing.� We attempt to identify head and shadow regions by
shape; head regions should not be merged above and shadow regions should not be
merged at all.
We rated candidate matches between regions in successive
images using consistency of shape and position with estimated speed, and then
used iterative relaxation to arrive at the most consistent ratings over the
whole sequence.� Probabilities of matches were approximated by normalizing
match probabilities both backward and forward.� That is, for each region of an
image, we made the probabilities for possible matches to the previous image sum
to one, and then made the probabilities of possible matches to the next image sum
to one as well, possibly undoing a little the first step.� Regions can also
appear and disappear near the image edges, and these possibilities are also
considered with a certain probability and rated.� Regions can also split and
merge between images, such as when one person passes in front of another, but
this likelihood is weighted low.� After sufficient relaxation, we eliminate for
each region all but the best remaining match choice forward and backward, or
conclude the region appeared or disappeared.� We use the matches to construct
contiguous tracks and exclude matches for short tracks.� We also infer short
gaps in tracks, such as when a person passes behind a car, by computing track
continuations in both directions.
Estimating typicality requires aggregating over all images
with the same camera view to estimate visit frequency, object size, and
velocity vectors over the field of view.� Sequences showing the same view were
found by comparing the 30 highest peaks of the Hough transforms of the computed
edges in the background images.� Similarity was measured using the angle,
offset, and number of pixels for each peak.� Based on this method, the 106
image sequences in our test dataset were categorized into 15 view groups.
4
Data collection
Our implementation was tested on a large dataset collected
under the Force Protection Surveillance System Project at the U.S. Army
Research Laboratory.� It was comprised of image sequences taken from the roof
of a building looking at a large parking lot.� People and vehicles were the
primary moving objects, but no faces or license plates can be recognized.�
Images were taken roughly 0.1 seconds apart.
The Thermal Vision Sentry Personnel Observation Device
manufactured by FLIR Systems was used, which consists of an infrared uncooled
microbolometer and a color visual camera, which are bore-sighted and integrated
in a sealed enclosure.� The microbolometer has a focal plane array resolution
of 320 � 240 pixels and a spectral response at the wavelengths of 7.5 to 13
microns.� To adequately capture the staged activities, the wider field of view
of 24� by 18� was used.� The color visual camera produces 460 television-style
lines; the field of view was adjusted to 24� so that the color and infrared
images could be co-registered.� Video was simultaneously captured by both
cameras and stored in separate video recorders.
A first dataset of 41,521 images was collected for training
purposes but lacked suspicious activities.� A second dataset of 71,236 images
was collected between November 2004 and January 2005 and showed a variety of
suspicious activities and behaviors of interest to force-protection and
security-surveillance experts.� About 10% of the activity in these sequences
was suspicious, and only three sequences did not have any suspicious activity.�
The 53 pairs of concurrent color-FLIR image sequences totaled 3.2 gigabytes in
storage.� A global linear transformation registered each image pair and scaled
them to 640 � 480 pixels.� The length of sequences varied from 140 to 990 frames,
as dictated by the duration of a given activity, with a 1000-frame output
length limit of the recorder.
A ground-truthing graphical user interface was developed
that plays selected image sequences and permits annotation of the objects via
mouse clicks.� Annotations could be �person�, �vehicle�, �animal�, �unknown�,
or �other�.� All frames of both datasets were so ground-truthed.� In addition,
prose descriptions on the ground truth activities associated with all sequences
in the second dataset were provided.
5
Experimental results and discussion
The first dataset was used for algorithm development and the
second dataset was used for testing.� Performance was measured by precision
(fraction of correctly identified suspicious behavior in all the behavior identified
as suspicious by the algorithm) and recall (fraction of correctly identified
suspicious behavior in all the suspicious behavior in the ground-truth
descriptions).� A threshold (0.3 for most experiments and 0.7 for experiments
with just the acceleration factor) was chosen to keep precision and recall
values close, to better estimate of the F-score (their harmonic mean, a
standard metric for classification tasks).� Assessment was done by manual
inspection of summary pictures like Figure 1 that show all the tracks for a
sequence and those portions with suspiciousness above the threshold.� The prose
ground-truth descriptions were sufficient for such assessment. 161,023
nontrivial path segments were identified in the images.� Table 1 shows the
averages separately for the 53 color sequences and 53 infrared sequences in
matched pairs; separately for using all suspiciousness factors and using just
the acceleration norm; and separately for suspicious actions involving object
placement or removal, loitering by people and cars, and other suspicious
behavior such as people running or appearing in unusual areas.
Table 1: Average precision,
recall, and F-score in experiments.
|
|
Color Sequences
|
Infrared
Sequences
|
|
|
Precision
|
Recall
|
F-score
|
Precision
|
Recall
|
F-score
|
|
All
factors
|
Suspicious
objects (11)
|
.45
|
.70
|
.55
|
.71
|
.80
|
.75
|
|
Loitering (16)
|
.69
|
.74
|
.71
|
.89
|
.79
|
.84
|
|
Other behaviors
(26)
|
.61
|
.67
|
.64
|
.68
|
.63
|
.63
|
|
Total
|
.60
|
.69
|
.64
|
.61
|
.72
|
.66
|
|
Accel.
factor
|
Suspicious
objects (11)
|
.52
|
.83
|
.64
|
.47
|
.87
|
.61
|
|
Loitering (16)
|
.67
|
.57
|
.62
|
.61
|
.62
|
.62
|
|
Other behaviors
(26)
|
.53
|
.50
|
.51
|
.67
|
.46
|
.55
|
|
Total
|
.57
|
.61
|
.59
|
.59
|
.62
|
.60
|
|
|
|
|
|
|
|
|
|
6
Discussion and conclusions
These results show that our algorithm was a success at
detecting suspicious behavior without requiring more general behavioral
classification.� Using it to guide security guards to manual inspection, only
one third of the alerts would be false alarms and one third of the true
incidents would be missed.� It is a significant improvement over the typical
human detection performance in a similar prolonged surveillance period, where
most of the incidents could be overlooked.� A good portion of the errors were due
to remaining mistakes in segmentation, such as separating a windshield from the
body of a vehicle or losing a track during occlusion, for which more
sophisticated techniques like particle matching or fusion of multi-camera data
could be helpful.� Experiments with other weightings of the factors confirmed
that changes in them did not improve performance.
Infrared imagery was more helpful than color imagery for the
classic tasks of detecting suspicious objects and loitering, due in part to the
easier segmentation of people in infrared imagery during the winter.� The
average of the acceleration norm at different time scales showed much better
than the other factors, with all but 9% of the overall performance attributable
to it.� We conclude that the acceleration norm should be the focus of future
work, although its relative value could be less in another kind of public
area.� Note that the acceleration norm is primarily an indicator of
decision-making (since it suggests force and volition), not of anomalousness.
These results are supported by experiments we have recently
conducted with nonimaging sensors [13].� If detecting accelerations is the key,
inexpensive sensor types may suffice for tracking, such as infrared, vibration,
audio, and pressure sensors.� Such sensors could detect when people are
present, and compare the signal strengths or times from at least three sensors
to locate them and infer whether the people are accelerating or decelerating.�
This would permit extending coverage for detecting suspicious behavior to areas
with occlusions due to walls and vegetation and to poor lighting conditions.
7
References
[1]
S. Hackwood and P. Potter, �Signal and image processing for crime
control and crime prevention,� in Proc. IEEE International Conference on
Image Processing, Kobe, Japan, October 1999, vol. 3, pp. 513-517.
[2]
M. Valera and S. Velastin, �Intelligent distributed surveillance
systems: a review,� IEE Proceedings � Vision, Image, and Signal Processing,
vol. 152, pp. 192-204, 2005.
[3]
H. Shao, L. Li, P. Ziao, and M. Leung, �ELETVIEW: An active elevator
video surveillance system,� in Proc. Workshop on Human Motion, Los Alamitos , CA, December 2000, pp. 67-72.
[4]
T. Meservy, M. Jensen, J. Kruse, D. Twitchell, J. Burgoon, D. Metaxas,
and J. Nunamaker, �Deception detection through automatic, unobtrusive analysis
of nonverbal behavior,� IEEE Intelligent Systems, vol. 20, no. 5, pp.
36-43, 2005.
[5]
R. Aguilar-Ponce, A. Kumar, J. Tecpanecatl-Xihuitl, and M. Bayoumi, �A
network of sensors-based framework for automated visual surveillance,� Journal
of Network and Computer Applications, Vol. 30, No. 3, pp. 1244-1277, August
2007.
[6]
D. Gibbins, G. Newsam, and M. Brooks, �Detecting suspicious background
changes in video surveillance of busy scenes,� Proc. 3rd IEEE Workshop on
Applications of Computer Vision, December 1996, pp. 22-26.
[7]
N. Rowe, �Detecting suspicious behavior from only positional data with
distributed sensor networks,� Proc. 5th International Conference on Multibody
Systems, Nonlinear Dynamics and Control, Long Beach, CA, September 2005.
[8]
A. Wiliem, V. Madasu, W. Boles, and P. Yarlagadda,� �Detecting uncommon
trajectories,� Proc. Digital Image Computing: Techniques and Applications,
Canberra, Australia, December 2008.
[9]
D. Barbara, C. Domeniconi, Z. Duric, M. Filippone, R. Mansfield, and E.
Lawson, �Detecting suspicious behavior in surveillance images,� Proc.
International Conference on Data Mining Workshops, Pisa, Italy, December 2008.
[10] G. Powell,
L. Tyska, and L. Fennelly, Casino surveillance and security: 150 things you
should know,� New York: Asis International, 2003.
[11] D. Wood, �In
defense of indefensible space,� in Environmental Criminology, P.
Brantingham and P. Brantingham, Eds.� Beverly Hills, CA: Sage, 1981, pp. 77-95.
[12] A.
Panangadan, M. Mataric, and G. Sukhatme, �Detecting anomalous human
interactions using laser range-finders,� in Proc. International Conference
on Intelligent Robots and Systems, September 2004, vol. 3, pp. 2136-2141.
[13] N. Rowe,
A. Reed, R. Schwamm, J. Cho, J. Flores, and A. Das, �Networks of simple sensors
for detecting emplacement of improvised explosive devices,� Chapter 16 in F.
Flammini (Ed.), Critical Infrastructure Protection, WIT Press, 2011.
8
Acknowledgments
This work was supported in part by the National Research
Council under their Research Associateship Program at the Army Research
Laboratory, and in part by the National Science Foundation under grant 0729696
of the EXP program.� Views expressed are those of the authors and do not represent
policy of the U.S. Navy or the U.S. Army.� Citation of manufacturer�s or trade
names does not constitute an official endorsement or approval of the use
thereof.�� We are grateful for help from Jonathan Roberts, E. John Custy,
Matthew Thielke, Vishav Saini, Bryant Lee, and Jamie Lin.�