Testing Simple Deceptive Honeypot Tools
Aymen Yahyaouia, Neil C. Roweb[*]
aTunisian Air Force, Tunis, Tunisia; bDept. of Computer
Science, U.S. Naval Postgraduate School, Monterey, CA USA
Abstract
Deception can be a useful defensive technique against cyber-attacks; it has the advantage of unexpectedness to attackers and offers a variety of tactics. Honeypots are a good tool for deception. They act as decoy computers to confuse attackers and exhaust their time and resources. This work tested the effectiveness of two free honeypot tools in real networks by varying their location and virtualization, and the effects of adding more deception to them. We tested a Web honeypot tool, Glastopf and an SSH honeypot tool Kippo. We deployed the Web honeypot in both a residential network and our organization's network and as both real and virtual machines; the organization honeypot attracted more attackers starting in the third week. Results also showed that the virtual honeypots received attacks from more unique IP addresses. They also showed that adding deception to the Web honeypot, in the form of additional linked Web pages and interactive features, generated more interest by attackers. For the purpose of comparison, we used examined log files of a legitimate Web-site www.cmand.org. The traffic distributions for the Web honeypot and the legitimate Web site showed similarities (with much malicious traffic from Brazil), but the SSH honeypot was different (with much malicious traffic from China). Contrary to previous experiments where traffic to static honeypots decreased quickly, our honeypots received increasing traffic over a period of three months. It appears that both honeypot tools are useful for providing intelligence about cyber-attack methods, and that additional deception is helpful.
This paper appeared in the Proc. of the 2015 SPIE Defense+Security Conference, Baltimore, MD, April 2015.
Keywords: Honeypots, deception, Glastopf, Kippo, testing, virtualization, Web sites, SSH
1. Introduction
Honeypots are computer systems that are designed to serve the single purpose of receiving and recording Internet attacks as a kind of decoy [1]. They can take advantage of being probed, attacked, or compromised by logging everything that happens to them for discovery of attack techniques [2, 3]. They can also be used to explicitly deter attacks, since attackers do not like their activities recorded. The Honeynet Project [4] is an international nonprofit organization providing a variety of open-source honeypot tools. Honeypots can be classified based on their level of interaction as low, medium, or high-interaction honeypots; as production honeypots or research honeypots; and whether they are implemented physically or virtually.
Honeypots can be more effective when they use deception because the more an Internet site looks legitimate and attractive to attackers, the more it draws their attention and interest. Our previous experiments have demonstrated some ways to encourage and discourage attackers [5]. The war against cyberattacks is still asymmetric in that cyberattackers have advantages over defenders. Deception is a useful defender technique not yet much explored that can divert the attention of attackers from the real assets and make them spend time and resources on attacking fake assets [6].
This work studied the effectiveness of two tools from the Honeynet Project that use deception against Internet attacks using honeypots. We assume that a honeypot is more effective when it receives more malicious traffic and a hacker spends a longer time interacting with it. We studied the influence of parameters in making these honeypots more or less attractive. We studied the effect of the location where the honeypots are run, and compared honeypots deployed in real machines to honeypots deployed in virtual machines. In addition, we tested adding more deception to the Web honeypot by modifications on the main Web page, using static Web pages, and redirecting traffic to other machines. We also examined the malicious traffic distribution for deceptive honeypots by countries and by regions, and the effect of the protocol in use in malicious traffic distribution.
2. TOOLS TESTED
This work studied two low-interaction research-honeypot tools of the Honeynet Project: Glastopf [7, 8], a tool for Web attack detection and analysis, and Kippo [9], a tool for detection of SSH brute-force attacks.
Glastopf is an open-source Web-application honeypot that emulates different types of vulnerabilities to collect data about attacks targeting Web sites. It has been in development since 2009 and is currently available in its third version. Its main principle is to respond to requests in the correct way to draw attackers' attention and trigger more interactions with the honeypot. It can detect attacks like SQL injection, remote-file injection, local-file injection, and others. We installed Glastopfv3 on an Ubuntu desktop 12.04 LTS operating system and indexed it in the Google search engine.
Glastopf especially targets automated attacks. It aims to provide what attackers expect to see and generates responses accordingly. When the attacker sends a malicious request, Glastopf processes it and uses a vulnerability emulator to respond in a way that suggests a vulnerability exists in the Web server. The data collected is stored in a SQLite database or files for analysis. Glastopf distinguishes between the HTTP methods GET, POST, and HEAD. It answers HEAD requests with a generic header. The entire content is stored when the attacker sends a POST request and the query is executed, but most of the time it handles GET requests and tries to identify attacks from predefined patterns. If an attack is identified, a response is generated as if the hacker were successful in his or her attack.
To attract hackers, Glastopf uses two main principles: dorks and attack surfaces. A dork is a vulnerable path on an application for which an attacker is looking. Generally, dorks are found using search engines that index them by crawling the web. The attack surface is a Web page that contains many dorks that the search engine adds to its index. The attack surface is generated dynamically from predefined dorks and then takes into consideration requests coming to the honeypots with new dorks that increase the size of the attack surface. This feature distinguishes Glastopf from most Web honeypots which have static attack surfaces. Its providing of features attractive to both attackers and crawlers, however, makes it hard to distinguish between the two. Requests coming to Glastopf are logged into a SQLite database. The Events table stores most of the logs; other tables store dork data.
Kippo is a medium-interaction SSH honeypot designed to log a brute-force attack coming on port 22. Such SSH attacks are becoming increasingly common [10]. Kippo permits logging the whole shell interaction with an attacker. It can also be used for deception by presenting a fake file system. Kippo stores events in a MySQL database. We installed Kippo version 0.8 on Ubuntu desktop 12.04 LTS, and we added Kippo-graph-1.1 to help us visualize and analyze the logs collected by the honeypot.
The Snort intrusion-detection tool [11, 12] was used with the two honeypots to monitor attacks coming to them. We configured Snort on a machine with two network cards; one of the network cards had no IP address, which reduced the possibility of compromise from an external machine. The other network card had a private IP address and was connected to the same network as an administrative machine. Ideally, the intrusion-detection system should be plugged into a mirrored port of a switch so that it can see all traffic going through it. Since we used a hub, the intrusion-detection system could be plugged into any of the hub ports.
We installed Snort on an Ubuntu machine 12.04 LTS. To visualize graphs about attacks, we installed the Snort reporter on the same machine. The latest public Snort rule set was downloaded and used to update the Snort rules. Barnyard2 was installed also to improve Snort efficiency and reduce the load on the detection engine. Barnyard2 stores unified output files from Snort to a MySQL database.
3. EXPERIMENTAL SETUP
We deployed Glastopf and Kippo in two environments, a residential network at home using an AT&T Internet connection, and an organizational network environment at the Naval Postgraduate School, which also uses AT&T as the service provider but is outside the school firewall. We collected logs in both locations. In the residential experiment (Phase 1), data collected was compared to data of a legitimate Web site (www.cmand.org). "The CMAND lab at NPS focuses on advanced measurement and analysis techniques for informing network architecture and developing novel solutions to real-world critical infrastructure issues including routing, provisioning, and security and forensics" [13]. The Web site is hosted at Massachusetts Institute of Technology, and it is administrated by professors at our school. We chose it because we had easy access to its Apache log files. For the network of NPS (Phase 2), we tested two methods of the honeypot deployment: direct installation on a Linux machine and installation on a virtual machine. To measure the attacks, we ran the Snort intrusion-detection system and the Wireshark network-traffic analysis tool. While the honeypots were running we modified them to encourage more malicious traffic coming to them. For example, we redirected the traffic coming to the Web honeypot to our own Web site where we added more Web pages and a background database. We also added links and keywords in the main Web page of the Web honeypot. We studied the impact of these modifications on the traffic coming to these honeypots.
Our experiment took place in two different locations. We started in a residential network where we used only one laptop connected to the Internet via a 2Wire AT&T router. We installed, ran, and collected logs for a Web honeypot over a two-month period. The data collected was compared to data collected by an Apache Web server for the Web site www.cmand.org. After that, we moved the laptop to NPS and used it as a real honeypot since it was installed directly on an Ubuntu machine. We also installed the SSH honeypot on the Ubuntu machine and collected logs for both honeypots over a three-month period. In the same location and for the same period of time, another laptop running the VMware player was used. We installed two virtual honeypots, the Web and SSH honeypots, on this second laptop.
In the first phase of the experiment, we used only one laptop, the real honeypot that was used in phase 2. In the second phase, we used three computers, one Dell desktop and two Lenovo laptops. The desktop was used as a network intrusion-detection system (NIDS). One of the laptops was used as the real honeypot, whereas the other served as the virtual honeypot. All the computers were connected to a hub that had an external Internet connection outside the NPS network firewall.
During the first phase of the experiment, a public IP address was needed for the Web honeypot to make it reachable at the home internal laptop. The only public IP address AT&T provides, however, is the router IP address. All other machines connected to the router require private IP addresses. For this reason, we had to configure port forwarding from the router to the honeypot machine that had a private IP address assigned via Dynamic Host Configuration Protocol (DHCP). This configuration permitted the Web honeypot to receive queries coming to the router on port 80 using the router's public IP address.
Phase 2 of the experiment was carried out at NPS. For security reasons, we were not allowed to install the honeypots inside the NPS network but were given an outside Internet connection. This permitted us to escape from the firewall rules that would have restricted us from receiving many queries from outside the NPS network. We obtained a public range of IP addresses, a gateway address, and a DNS server address (Figure 1). We installed Ubuntu Desktop 12.04 LTS Linux operating system on the real honeypot and the network IDS. For the virtual honeypot we installed Microsoft Windows 7 Service Pack 1 since this receives a higher rate of attack than a Linux system. The VMware player was installed on both honeypot machines. We installed Glastopf v3 (Web honeypot) and Kippo 0.8 (SSH honeypot) directly on the real honeypot. We installed them on two virtual machines running Ubuntu 12.04 LTS on the virtual honeypot, however. Snort version 2.9.6 was installed on the network intrusion-detection machine. Table 1 summarizes the programs installed on each of the three machines.
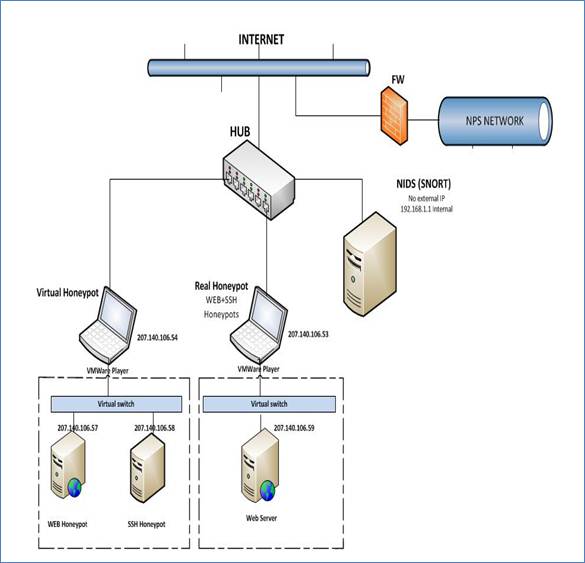
Figure 1: Setup of Experiment 2.
4. Data Analysis
4.1 Phase 1 of the experiment
We ran Glastopf at the residential network and collected logs for three weeks between October 31, 2013 and November 18, 2013. Logs for the same period of time for events in the Web site cmand.org (Apache server) were available, too, and were used afterwards for comparison.
Glastopf recorded 3,052 events with an average of 160 events per day. Only 367 events, however, were identified to be malicious, with an average of 19 events per day. In the first three days, the number of events was considerably higher (Figure 2) no doubt due to curiosity by attackers. After some days, crawler activities decreased and the total number of events dropped. As for attacks by countries, we noticed that crawlers had the highest rate of Internet events followed, by the countries France (146), Netherland (117) and the U.S. (50). To identify crawlers, we used an SQL query to find IP addresses containing the string "66.249" in the beginning, which are the common IP address prefixes for Google bots.
Table 1: Parameters for Experiment 2.
|
Real Honeypot |
|
|
Operating System |
Ubuntu Desktop 12.04 LTS |
|
Web Honeypot |
Glastopf v3 |
|
SSH Honeypot |
Kippo 0.8 |
|
Virtual Machine software
|
VMware player 5.0 was used to deploy a Ubuntu Desktop 12.04 LTS Web server (Apache Tomcat 7) |
|
Virtual Honeypot |
|
|
Operating System |
Microsoft Windows 7 service pack 1 |
|
Virtual Machine software |
VMware player 3.1.1 |
|
Virtual Web Honeypot |
Glastopf v3 |
|
Virtual SSH Honeypot |
Kippo 0.8 |
|
NIDS |
|
|
Operating System |
Ubuntu Desktop 12.04 LTS |
|
IDS |
Snort version 2.9.6 |
Figure 2: Number of attacks observed on cmand.org.
We expected to see attacks coming from Asian countries like China, but the numbers were low. This may be explained by IP spoofing or the insufficiency of three weeks of observation. Most attackers use IP addresses without any domain name (75%) because attackers generally prefer not to give any clue about their identity or location. The top-level domain "com" had the highest rate (11%), followed by the top-level domain "net" (7%). We also counted the top requested URLs during the same period of time (Table 2). Mostly Glastopf recorded requests for robots.txt that attackers usually access in the fingerprinting stage of a Web site. We also noticed requests for the phpMyAdmin index page that attackers use to get information about MySQL databases in the background.
Table 2: Top 10 Web page requests in Experiment 1.
|
count |
|
|
/robots.txt |
110 |
|
/ |
59 |
|
/style.css |
57 |
|
/phpMyAdmin-2.5.5/index.php |
46 |
|
/phpMyAdmin-2.5.5-pl1/index.php |
46 |
|
/cgi-bin/style.css |
14 |
|
/comments |
13 |
|
/bb_lib/style.css |
9 |
|
/PMA/ |
8 |
|
/cgi-bin/.br/style.css |
7 |
In the same way, we collected log files recorded by an Apache Web server for the legitimate Web server www.cmand.org. We expected to receive fewer attacks than the Web honeypot because the second generated fake responses to attract hackers to it. It was not easy to separate normal traffic from malicious traffic, so some clues were assumed. For instance, we assumed that error codes returned from the Web server (404,401…) indicated attacks. IP addresses' origin and time stamps were also assumed to be clues for attacks. For example, the same packet found several times from an IP address outside the U.S. with close timestamps was deemed to be an indication of an attack targeting the Web site. Finally, we assumed that Post queries coming to the Web server identified malicious activities, because a Web site is not supposed to receive these kinds of queries.
We recorded the number of attacks every day during the same period of time, and noticed that the number of events for www.cman.org was less than the number of events for the Web honeypot. Between November 15 and November 18, however, the site had a high attack rate from the Chinese IP address 36.250.243.40. For events recorded by countries, China (60%), the U.S., and the Ukraine were the leaders in Internet attacks coming to www.cmand.org. The same result was obtained, with the highest rates obtained for IP addresses without any domain name, followed by top-level domains "com" and "net".
In the first phase of the experiment, our hypothesis was if the honeypot works well, it should be able to detect more attacks than a legitimate Web server, because it has the ability to simulate vulnerabilities that attackers are looking for. Indeed, the number of attacks was higher for the Web honeypot than for the legitimate Web server, confirming our hypothesis.
4.2 Analysis of Phase 2
In phase 2, we ran the Web and SSH honeypots for three months in physical and virtual machines, and we collected data for malicious traffic in each case. We compared the residential data with that of the NPS Web honeypots collected in the first six weeks. The average was 1,314 events per day for the NPS real Web honeypot and 1,307 events per day for the NPS virtual Web honeypot. Furthermore, 97% of the data was malicious for the NPS real Web honeypot and 94% of the data was malicious for the NPS virtual Web honeypot. We recorded an average of 98 events per day for the residential Web honeypot, however, with only 29 malicious events per day (only 30%). So, more than 70% of residential Web honeypot events were crawler activities, whereas less than 10% were crawler activities for the NPS Web honeypots. This is interesting because the NPS honeypots were not identified as being Government computers in URL indexes (since they did not connect through the School firewall), just by the index information provided by the Internet Service Provider of AT&T. So either attackers are accessing this index information routinely or they remembered the enticing nature of our School honeypots from experiments several years previously [5].
The number of events increased significantly to high rates for NPS Web honeypots in the third week. Figure 3 shows the number of attacks coming to all three types of Web honeypots: the residential Web honeypot in blue, the NPS real Web honeypot in red, and NPS virtual Web honeypot in green. In each vertical set of dates across the bottom of the chart, the first (lower) date that has the year 2013 corresponds to the residential honeypot date, and the second (upper) date that has the year 2014 is the NPS Web honeypots date. Toward the end of the third week, attacks coming to NPS Web honeypots increased significantly to high values. This could be because the two Web honeypots became well advertised. We also plotted the number of events recorded by the honeypots, and the only difference in curve shape was a large peak which we surmise was due to Google's crawlers indexing our site.
Figure 3: Number of attacks for the residential and school honeypots.
After three months, we noticed (Figure 4) that the virtual Web honeypot received more events than the real Web honeypot. This was true for both crawler and attack events. We eliminated crawler data and retained only malicious data. Overall, the virtual honeypot (in red) received more malicious data than the real honeypots.
Figure 4: Event count comparison for the real and virtual Web honeypots.
To analyze this difference further, we identified four time periods: A, B, C and D (Figure 5). In period A, the two honeypots started with low rates during the first few weeks despite a small peak during the first days of indexing them. This appears to be because the two Web honeypots, after being indexed, took a few days to be examined by crawlers, and only then started receiving malicious requests. In the beginning of phase B, we noticed that the real honeypot had higher rates than the virtual honeypots; after that, the virtual Web honeypots received higher numbers of attacks. After a certain period of time, the virtual Web honeypots started to be less interesting to attackers, and the number of attacks dropped significantly at the end of phase B.
To make the Web honeypots more efficient, we added links at the end of period B in the main Web page for both honeypots that redirected traffic to our own Web server. The Web server was running in a virtual machine installed in the real Web honeypot. The Web site has only a sign-up page where users can enter information like username, password, email address, phone number and address. It has also a MySQL database running in the background for storing information. This redirection affected the amount of malicious traffic coming to both honeypots. We can see that in period C the number of malicious activities increased significantly. Although we did not find many sign-up attempts because most of the malicious traffic is automatic and cannot handle interactive sites, putting links to another Web site resulted in more malicious traffic coming to both honeypots. At the end of period C, the traffic decreased again; we suppose that the Web honeypots started losing the attention of attackers after a certain period of time.
We added static Web pages to the index page for the honeypots in period D. This modification again stimulated the traffic received, and we saw a peak in the middle of period D. Toward the end of period D, the traffic decreased again.
Figure 5: Attack events over time for the real and virtual Web honeypots.
Figure 6 shows attacks by IP addresses for the real Web honeypot; the statistics for the virtual Web honeypot were similar. The first three attacking IP addresses were located in the U.S., followed by attacks coming from Ukraine, France and China. Almost the same IP addresses were seen for both NPS Web real and virtual honeypots. We noticed, however, that the same IP addresses launched more traffic against the virtual honeypot than against the real honeypot. As an example, the IP address 173.208.182.74 was the origin of 11,789 malicious events against the real Web honeypot and 19,406 events against the virtual Web honeypot. Crawlers occupied the fourth position with more than 4,000 events for both honeypots.

Figure 6: Top 10 attacker IP addresses for the real Web honeypot.
Tables 3 and 4 show the top 10 URLs requested for the real and virtual Web honeypots. The same URL was requested more often for the virtual Web honeypot than for the real Web honeypot. Also, although the top attacking IP addresses were the same, the two honeypots had different URL requests.
Table 3: Top 10 request URLs from the real Web honeypot.
|
Order |
requested URL |
Count |
|
1 |
/comments |
6,849 |
|
2 |
/cgi-bin/comments |
4,578 |
|
3 |
/pivotx/includes/timthumb.php |
3,271 |
|
4 |
/board/board/include/pivotx/includes/wp-content/pivotx/includes/timthumb.php |
3,022 |
|
5 |
/sqlmanager/setup.php |
2,954 |
|
6 |
/irekani/browse |
2,869 |
|
7 |
/bb_lib/comments |
2,845 |
|
8 |
/plugins/content/plugin_googlemap2_proxy.php |
2,831 |
|
9 |
/phpMyAdmin-2.6.3-pl1/scripts/setup.php |
2,813 |
|
10 |
/cgi-bin/standard.php |
2,585 |
Table 4: Top 10 URLs requested from the virtual Web honeypot.
|
Order |
requested URL |
Count |
|
1 |
/comments |
7,874 |
|
2 |
/cgi-bin/comments |
7,576 |
|
3 |
/dbadmin/comments |
4,116 |
|
4 |
/.br/comments |
3,191 |
|
5 |
/server-status/ |
2,845 |
|
6 |
/cgi-bin/newsletter/admin/home.php |
2,639 |
|
7 |
/cgi-bin/enter.php |
2,399 |
|
8 |
/wp-phpmyadmin/phpmyadmin/setup.php |
2,395 |
|
9 |
/admin.php |
2,377 |
|
10 |
/phpMyAdmin-2.6.0-alpha/scripts/setup.php |
2,374 |
The two SSH honeypots (real and virtual) implemented with Kippo operated for more than four months. This period of time was sufficient to collect brute-force or dictionary-based attacks and compare results for the honeypots. The visualization tool "Kippo-Graph" was used to generate statistics and graphs from the MySQL database running in the background.
We recorded 369,538 login attempts from 1,039 unique IP addresses for the real SSH honeypots between Feb 6, 2014 and July 17, 2014 (162 days). Average login attempts were 2,281 per day, and the average number of logins attempted per IP address was 355. The virtual SSH honeypot operated between March 30, 2014 and July 17, 2014 (109 days), and it received 235,485 login attempts from 669 unique IP addresses. The average number of logins attempted was 2,160 per day, and the average login attempted per IP address was 351.
Figures 7 and 8 shows the top 10 usernames attempted for the real and virtual Kippo honeypots, and Figures 9 and 10 show the top 10 passwords attempted. Although the two honeypots were running in the same location on the same subnet, they received different login and password attempts. For the real SSH honeypot, the most common username attempted was "root" (87,197 times) followed by "admin" (11,776 times); the most common password attempted was "admin" (1,158 times) and "password" (548 times). The virtual SSH honeypot recorded 186,214 attempts for the "root" username and 46,337 for the "admin" username, and the top passwords were "admin" (4,248 times) and "PASSword" (2,268 times). Clearly, we are seeing some randomization in attacks.
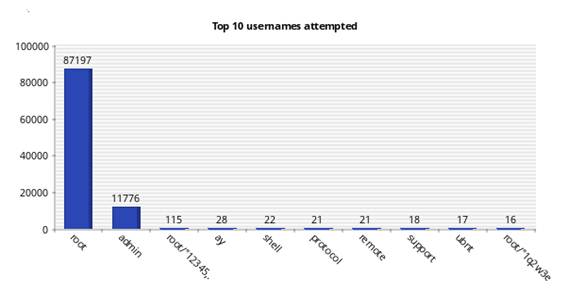
Figure 7: Top 10 usernames attempted for the real SSH honeypot.
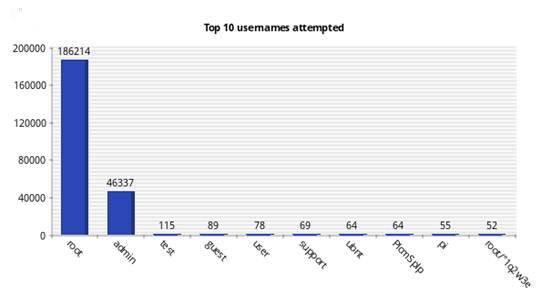
Figure 8: Top 10 usernames attempted for the virtual SSH honeypot.
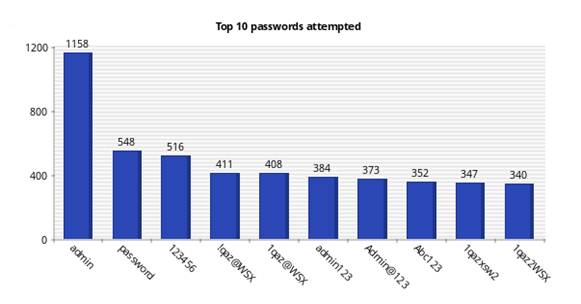
Figure 9: Top 10 passwords attempted for the real SSH honeypot.
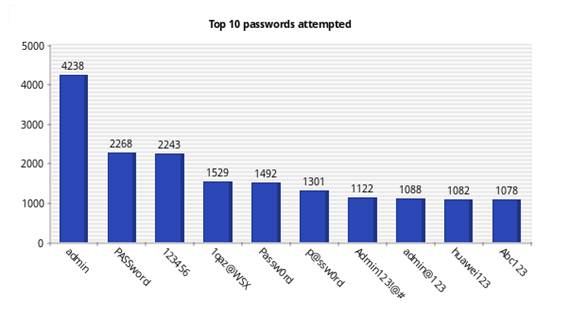
Figure 10: Top 10 passwords attempted for the virtual SSH honeypot.
The 10 most common sources of connections for the real and the virtual SSH honeypots were in China. The IP address 61.174.51.198 was the highest (with 298 connections) to the real SSH honeypot, whereas the IP address 1.93.26.15 was the highest (with 447 connections) to the virtual SSH honeypot.
We also compared the traffic distribution of the Web and the SSH honeypots against a legitimate Web site (www.cmand.org). We used data from cmand.org (183,713 IPv4 packets and 199 IPv6 packets) from May 30, 2011 to November 26, 2013. For the Web honeypot, data were collected from October 31, 2013 to February 21, 2014 (6,915 packets). Finally, we collected data for the SSH honeypot (3,920 packets) from February 2, 2014 to February 22, 2014. For the Web honeypot, we analyzed data with and without crawler traffic (e.g., Google spiders that systematically browse the World Wide Web for the purpose of indexing). We used a Python program that called the API GeoIP to geolocate IP addresses for the datasets for cmand.org, the Web honeypot with crawlers, the Web honeypot without crawlers, and the SSH honeypot. For our study, we focused only on unique IP addresses; further analysis could be done, however, by considering the whole data sets.
IPv4 data from cmand.org showed 43% of the traffic came from the American region (ARIN), 33% from the Asian region, and 22% from the European region. Less than 3% came from the Latin American region (LACNIC) and the African region (AFRINIC). This result made sense since the Web site was hosted in the U.S. and is related to academics. As for IPv6, a high percentage for IPv6 addresses originated from Europe (56%) and relatively low percentage for addresses coming from Asia (7%). This makes sense since the RIPE region has always been ahead in IPv6 [14]. APNIC had more ASes than ARIN only until 2008, when the IPv6 AS growth rate in the ARIN region changed to exponential.
By comparing unique IPv4 traffic coming to cmand.org (legitimate traffic) and unique IPv4 traffic without crawlers coming to the honeypot (malicious traffic), we noticed that the two plots looked very similar. We see more malicious traffic, however, in the LACNIC region (12%), against (1%) for the legitimate traffic. This is explained by the fact that most of the LACNIC traffic came from Brazil, which is one of the top hacking countries; Brazil accounted for 3.3% of the world's attack traffic during the fourth quarter of 2012, putting the country in sixth place. We expected, however, to see a higher percentage for traffic originating from the APNIC region where China is the top-ranked country in the origin of malicious traffic [15]. The reason might be the different attack channels used by Chinese and Brazilian hackers. The Chinese attackers seem to use SSH more often than others based on our SSH data; 80% of the traffic came from the APNIC region, mainly from China.
The traffic distribution coming to the SSH honeypot looked quite different from the distribution of the Web honeypot and legitimate Web server. Most of the data came from the APNIC region (80%), especially from China. The remaining regions had small percentages (6 to 10 %) except for the AFRINIC region (0%). SSH channels are often used to escape censorship and tracking in China and this might be the reason. In general, results with our datasets were consistent with the IPv6 study of [14]. We also noted that LACNIC traffic differed between legal traffic and attack traffic.
5. ConclusionS
This research tested two open-source honeypot tools, Glastopf for Web honeypots and Kippo for SSH honeypots. Both gave us many useful results and both appear to be useful tools for information-security analysis.
We first ran the Web honeypot in a residential network, and then in a school network. The school Web honeypot received more attacks starting in the third week, showing that the location where the honeypot is deployed has an important effect on its effectiveness. Attackers frequently use automated scripts to search for vulnerable servers advertised by Web crawlers, and target locations where there is a high probability of finding important servers. They probably concluded that our NPS site was more promising.
We compared attacks coming to a Web honeypot to attacks coming to a different Web site, www.cmand.org and the Web honeypot received more attacks in the same period of time. Furthermore, by adding deception to the Web honeypot running at NPS, we could attract more attacks to it. We added links to static Web pages inside the main index honeypot Web page; we put these static Web pages in the same source folder of the index Web page of the honeypot; and we redirected traffic to our running Web server by permitting malicious users to click a button for a signup form. Redirection did appear to provide more interest by attackers to the Web site.
For the SSH honeypots (real and virtual), results showed that the number of incoming attacks was similar for both of them. However, we recorded more unique IP addresses targeting the virtual SSH honeypot. Also, we saw some command-line interaction for the virtual Web honeypot not found for the Real SSH honeypot.
We also examined the source-site distribution of malicious traffic, and compared it to a legitimate traffic distribution generated of the site www.cmand.org. The malicious traffic distribution looked similar to the legitimate traffic distribution, but we saw more malicious traffic in the LACNIC region which came from Brazil, one of the top hacking countries. For the SSH honeypot, most of the traffic came from the APNIC region, especially from China.
Future work should consider testing more techniques for deception since adding more deception to the Web honeypot made it more effective. Modifications to the http protocol could be a source of new deception techniques. Also, we could make our Web site more attractive by providing more useful information.
6. REFERENCES
[1] Spitzner, L., [Honeypots: Tracking Hackers], Addison-Wesley, Reading, MA, USA, 2003.
[2] Iyatiti, M., and Adams, M., "Honeypots: Concepts, Approaches, and Challenges," ACM Proceedings of the 45th Annual Southeast Regional Conference, pp. 321‒326, 2007.
[3] Kreibich, C., and Crowcroft, J., "Honeycomb - Creating Intrusion Detection Signatures Using Honeypots," ACM SIGCOMM Computer Communication Review, vol. 34, no. 1, pp. 51‒56, January 2004.
[4] Anonymous, "The Honeynet Project," <https://www.honeynet.org>, 2014.
[5] Frederick, E., Rowe, N., and Wong, A., "Testing Deception Tactics in Response to Cyberattacks," National Symposium on Moving Target Research, Annapolis, MD, June 2012.
[6] Rowe, N., "Deception in Defense of Computer Systems from Cyber-Attack," in Cyber War and Cyber Terrorism, Colarik, A, and Janczewski, L., eds., The Idea Group, Hershey, PA, USA, 2007
[7] Rist, L., "Glastopf Project," <http://www.glastopf.org>, 2014.
[8] Rist, L., Vetsch, S., Kossin, M., and Mauer, M., "Know Your Tools: Glastopf - A Dynamic, Low-Interaction Web Application Honeypot," <https://www.honeynet.org>, 2010.
[9] "Kippo SSH Honeypot," <http://code.google.com/p/kippo>, 2014.
[10] Koniaris, I., Papadimitrio, G., and Nicopolitidis, P., "Analysis and Visualization of SSH Attacks Using Honeypots," in Proc. IEEE Eurocon, 2013.
[11] Anonymous, "SNORT," <http://www.snort.org>, 2014.
[12] Ur Rehman, R., [Intrusion Detection Systems with Snort Advanced IDS Techniques Using Snort, Apache, MySQL, PHP, and ACID], Prentice Hall PTR, Upper Saddle River, NJ, USA, 2003.
[13] Anonymous, "CMAND: Center for Measurement and Analysis of Network Data @ NPS," <http://www.cmand.org>.
[14] Dhamdhere, A., Luckie, M., and Huffaker, B., "Measuring the Deployment of IPv6: Topology, Routing and Performance," in Proceedings of Internet Measurement Conference (IMC), November 2012.
[15] Anonymous, "Solutions for State and Local Goverment: Government Technology," <http://www.govtech.com/ security/204318661.html>.