INTRODUCTION
Ground sensors on current battlefields are usually emplaced by humans who are exposed to danger in the process.� These sensors weigh tens to hundreds of pounds, and have limited sensing lives, limited communications distance, and limited maneuverability.� But new technology is markedly reducing the size and increasing the lifetime, communications distance, and manueverability of sensor technology [1].� It is important to plan now how to use it, and in particular the massive deployments and random deployments that may be possible and desirable with large numbers of inexpensive sensors.� Simulation models are the most cost-effective way to study such deployments.� This work investigates such an approach.
To be more concrete, consider an infantry company consolidating after a protracted battle.� Suppose they are ordered to establish a defensive position on a recently assaulted objective and prepare to defend it against counterattack.� The company commander surveys the terrain and orders his platoons to their defensive positions.� He would also set up observation posts and launch external patrols for early warning against enemy infiltrations and attacks.� A future commander might use a wearable computer to request thousands of dust-size sensors be deployed forward of his position to check for traversals.� The platoon commanders could also release small portable autonomous sensor vehicles to cover gaps in coverage and recognize a broader range of threats.� The company could use wearable computers to monitor the sensor net, visualize detected targets, and send information up the command hierarchy.� Today the United States could use sensor fields to catch insurgents crossing into Iraq.� Battlefield sensors can monitor friendly forces, equipment, and ammunition; reconnoiter opposing forces and terrain; assist in targeting; assess battle damage; and detect weapons of mass destruction [2].
SENSOR characteristics and DEPLOYMENT
Sensors typically have five components: sensing hardware, memory, a battery, an embedded processor, and a receiver/transmitter.� They can be large unmanned flying vehicles; medium-sized tanks autonomously searching for lost combatants; small devices attached to warriors for health monitoring; devices attached to neurologically guided mice; particles floating in the air that sense chemicals; and objects on the ground.� Sensor networks have more primitive components than wireless networks and tend to be more densely-deployed, fault-tolerant, and power-limited [2].
Sensors can monitor temperature, pressure, humidity, soil makeup, vehicular movement, noise levels, lighting conditions, the presence or absence of certain kinds of objects or substances, mechanical stress levels on attached objects, and other properties [3]. �Their mechanism may be seismic, magnetic, thermal, visual, infrared, acoustic, or radar [2].� These mechanisms work in one of three ways: by a line of sight to the target (such as visual sensors), by proximity to target (such as seismic sensors), and by propagation like a wave with possible bending (such as acoustic sensors).
[4] and [5] developed the idea of networks [6] of many mobile and possibly imperfect sensors.� They described three useful coverage situations.� Sweep coverage moves a number of sensors across a coverage area to maximize the number of detections per unit time; examples include minesweeping and search-and-rescue.� Area coverage [7] maximizes the detection of targets appearing within the coverage area; examples include detecting chemical-agent attacks and providing early warning of forest fires.� Barrier coverage minimizes the probability of undetected traversal from one area to another [8].� Sensors may be deployed either manually or autonomously.� Deployment can be (a) from a single source point (e.g., airdrop in a canister or off the back of a moving vehicle), (b) in a linear pattern of appropriate density (e.g., sequential deployment from a moving platform), or (c) in a random initial pattern either dense or sparse (e.g., air burst dispersal).
[9] and [3] develop equations to model overall costs of a sensor network given costs of deployment, the number of sensors deployed, the sensor costs, and the effectiveness of the deployment.� [10] presents a resource-bounded optimization framework for sensor-resource management under sufficient coverage of the sensor field.� [11] presents a coding-theory approach to target location in distributed sensor networks; they bound the number of sensors needed, and offer methods for determining their placement in the sensor field using integer linear programming.
Potential fields [12] can be used to guide sensors to good-coverage locations.� Work on multi-target tracking using robots [13] attempts to maximize the number of tracked targets within a region. [14] analyzes self-organizing algorithms for area coverage for their effect on reduced energy consumption.� The Art Gallery Problem considers the placement of line-of-sight sensors so that every key point in an area is visible via at least one camera [15]. �[16] addresses the problem of finding paths of lowest and highest coverage, good for barrier coverage, using Voronoi (nearest-point) diagrams.
Autonomous deployment algorithms for mobile sensors [17] are useful when communications are limited, the number of sensors is large, or the sensors do not maintain an internal representation of the area to be covered.�� [7] describes deployment algorithms for sensor robots and reports real-world autonomous sensor deployment.� Virtual forces direct the sensors to more optimum locations in [18].� [19] proposes a "greedy" policy to control a swarm of autonomous agents in the pursuit of one or several evaders.
THE SIMULATION EXPERIMENTS
We built a simulation system to study of the effectiveness
of the abovementioned sensor deployment methods under variations in the kind of
sensor, their mobility, and the presence of untraversable obstacles [20].� We
model sensor detection probabilistically using the approach of [8].� It assumes
that a property has strength proportional to ![]() where d is distance from target to
sensor [10].� Often k=2 as with chemicals or sounds deriving from a point
source, since the surface area of a sphere is proportional to the square of its
radius. We also assume sensors have a probability of detection which is a
sigmoid function of the signal strength.� Our experiments assumed a 400m square
area and the sensors with a 50 percent probability of detecting a target 35m
away.
where d is distance from target to
sensor [10].� Often k=2 as with chemicals or sounds deriving from a point
source, since the surface area of a sphere is proportional to the square of its
radius. We also assume sensors have a probability of detection which is a
sigmoid function of the signal strength.� Our experiments assumed a 400m square
area and the sensors with a 50 percent probability of detecting a target 35m
away.
Sets of sensors can arrive at a consensus either by totaling all measurements and comparing the sum to a threshold (value fusion) or by treating local decisions like votes (decision fusion) [21].� Our simulation uses value fusion and the assumption that noise has a Gaussian distribution.� Our barrier coverage metric is the detectability of the least-detectable path that crosses the area of interest, assuming detection by a single sensor is sufficient.
Static sensor placement was studied with several algorithms.� Random deployment finds random points away from obstacles and other sensors.� Best-first placement deploys sensors one at a time so that the area around each is the least-covered point in the space.� Best-path for barrier coverage is similar to best-first except it considers only points on the current least-detectable path.� "Greedy" placement puts each successive sensor at the place improving coverage the most.� "Greedy path" is similar to greedy except it considers only points on the current least-detectable path.� Genetic-algorithm sensor placement generates a population of random sensor deployments and tries to find variations on the best-performing placements.� Simulated annealing is a special kind of genetic algorithm where randomness decreases slowly analogously to the cooling of molten metal.
Mobile sensors can dynamically find a good placement by either localized or centralized methods; localized is popular because of recent research on "emergent behavior" of a group of agents [22].� Finding the right set of local behaviors to create a desired group behavior is difficult, but localized behavior can readjust placement in response to changing conditions and sensor failures.� For mobile-sensor simulation we used potential fields [23] for placement of sensors, as they are common for controlling robot motion. �Subsensors sense repulsive or attractive forces from obstacles and other sensors.� Subsensors are deployed in 24 directions radially around the vehicle and at several positions along each radial line.� The vehicle agent chooses a direction to move based on a neural network operating on the subsensor readings.� A heading-change threshold is important to prevent oscillation between two or more directions.� Figure 1 shows an example autonomous deployment of mobile sensors in four snapshots, where the sensors begin in the lower right of the diagrams.� For barrier coverage, we got best results when sensors repelled each other in the direction of expected traversal (horizontal in Figure 1) and attracted each other perpendicularly to that direction; "gauntlets" or barrier chains then tended to emerge.
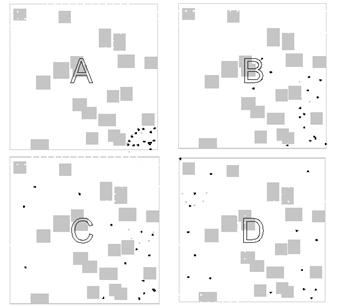
Figure 1: Example of autonomous dispersion of mobile sensors for area coverage; dark dots are the sensors.
Our simulation is implemented in Java.� It requires 50 Java classes of about 30,000 lines of code.� It uses a multi-agent approach to represent mobile sensors.� Scenarios are defined by XML-format files and run to completion or until the user interrupts with input.� Both two-dimensional (Figure 1) and three-dimensional (Figure 2) graphic displays show what is happening, and the user can zoom in and out to study details.
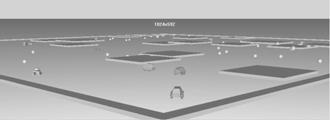
Figure 2: Example three-dimensional display of mobile sensors.
RESULTS
We conducted a wide range of experiments [20] and can only show some sample results here.� For barrier (traversal) coverage and stationary sensors, we estimated the probability of detection by at least one sensor on the least-detectable path.� We did this by repeated experiments, both with and without random untraversable rectangular obstacles (Table 1).� Experiments like these provide guidance as to how many sensors to use per unit area.
Table 1: Average percent barrier coverage for random sensor deployment.
|
Number of sensors |
2 |
10 |
15 |
20 |
|
Percent coverage, no obstacles |
4 |
41 |
64 |
85 |
|
Percent coverage, with obstacles |
6 |
25 |
39 |
55 |
�
When deploying sensors, if too many are deployed at once, we waste resources; but if too few are deployed, we may need to later deploy more at extra cost.� So we experimented with varying the cost Cd for each deployment step and the cost Cs of each sensor deployed.� Figures 3 and 4 show the cost to achieve 80% coverage using random deployment for representative parameters, on terrain without obstacles, for barrier coverage, and with stationary sensors.� It appears that deploying 23 sensors at a time was optimal with our assumptions for Figure 4.� Results were very similar with obstacle occlusion, unlike for Table 1.
 Figure 3: Cost of achieving 80% coverage as a function of the number of sensors added at each
deployment step, when deployment cost is negligible.
Figure 3: Cost of achieving 80% coverage as a function of the number of sensors added at each
deployment step, when deployment cost is negligible.
Figure 4: Cost of achieving 80% coverage as function of the number of sensors added at each deployment step, when deployment cost is not negligible.
We also studied nonrandom deployment in the 400m square area.� Figures 5 and 6 compare eight algorithms for barrier coverage; results for area coverage were similar but with fewer differences between algorithms.� It can be seen that the Greedy algorithm was the worst and Genetic and Greedy-Path were the best.� Autonomous deployment, the only algorithm here for mobile sensors, was reasonable, and Random was not too bad despite being cheap to do.

Figure 5: Comparison of the performance of eight sensor-deployment algorithms for barrier coverage without obstacles.

Figure 6: Comparison of the performance of eight sensor-deployment algorithms for barrier coverage with random rectangular obstacles.
Another factor to consider is the average computation time of these algorithms (see Table 2).� All except Best First and Greedy ran quickly, and Genetic and Simulated Annealing actually ran faster with more sensors to place because final deployment was closer to initialization.
Table 2: Average computation times (in seconds, rounded to the nearest second) for deployment algorithms.
|
Algorithm |
Time for 3 sensors |
Time for 6 sensors |
Time for 10 sensors |
|
Random |
0 |
0 |
0 |
|
Greedy Path |
0 |
2 |
6 |
|
Best Path |
0 |
0 |
0 |
|
Genetic |
182 |
38 |
8 |
|
Simulated Annealing |
404 |
35 |
7 |
|
Best First |
20 |
90 |
245 |
|
Greedy |
12 |
50 |
90 |
�
References
[1] Defence Modelling and Simulation Office (DMSO).� �Smart Sensor Web:� Experiment Demos Network Centric Warfare,� www.dmso.mil/public/pao/stories/y_2002/m_04, May 2003.
[2] Akyildiz, I.F., Su, W., Sankarasubramaniam, Y., Cayirci, E., �Wireless Sensor Networks: A Survey,� Computer Networks, 38, 393-422, 2002.
[3] Estrin, D., Govindan, R., Heidemann, J., Kumar, S., �Next Century Challenges: Scalable Coordination in Sensor Networks,� ACM MobiCom�99, 263-270, 1999.
[4] Gage, D.W. �Sensor Abstractions to Support Many-Robot Systems,� RDT&E Division, Naval Command Control and Ocean Surveillance Center, 1992.
[5] Gage, D.W. �Randomized Search Strategies with Imperfect Sensors,� Proceedings of SPIE Mobile Robots VIII, Boston, 9-10 September 1993, pp 270-279.
[6] Perkins, C. Ad Hoc Networks, Addison-Wesley, 2000.
[7] Howard, A., Mataric, M.J., Sukhatme, G.S., �An Incremental Self-Deployment Algorithm for Mobile Sensor Networks,� Autonomous Robots, Special Issue on Intelligent Systems, 2002.
[8] Clouqueur, T., Phipatanasuphorn, V., Ramanathan, P., Saluja, K.K., �Sensor Deployment Strategy for Target Detection,� WSNA�02, Atlanta, GA, 2002.
[9] Choset, H., �Coverage for Robotics � A Survey of Recent Results,� Annals of Mathematics and Artificial Intelligence, 31, 113-126, 2001.
[10]�� Dhillon, S.S., Chakarabarty, K., �Sensor Placement for Grid Coverage under Imprecise Detections,� Dept. of EE & CE, Duke University, Durham, NC, 2002.�
[11] Chakrabarty, K., Iyengar, S.S., Qi, H., Cho, E., �Grid Coverage for Surveillance and Target Location in Distributed Sensor Networks,� IEEE Transactions on Computers, vol. 51, 2002.
[12]�� Vaughan, R., Sumpter, N., Henderson, J., Frost, A., Cameron, S., �Robot Control of Animal Flocks,� BioEngineering Division, Silsoe Research Institute, Silsoe, Bedford, UK, 1995.
[13]�� Jung, B., Sukhatme, G.S., �A Region-Based Approach for Cooperative Multi-Target Tracking in a Structured Environment,� 2002 IEEE/RSJ International Conference on Intelligent Robots and Systems, 2002.
[14]�� Gupta, H., Das, W.R., Gu, Q., �Connected Sensor Cover: Self-Organization of Sensor Networks for Efficient Query Execution,� Mobihoc�03, Annapolis, MA, 2003.
[15]�� Marengoni, M., Draper, B., Hanson, A., and Sitaraman, R.� �System to Place Observers on a Polyhedral Terrain in Polynomial Time.�� Image and Visual Computing, 1996.
[16]�� Meguerdichian, S., Koushanfar, F., Potkonjak, M., Srivastava, M.B., �Coverage Problems in Wireless Ad-hoc Sensor Networks,� CS Dept and EE Dept, UCLA, 2000.
[17]�� Borenstein, J., Everett, H.R., Feng, L., Wehe, D., �Mobile Robot Positioning � Sensors and Techniques,� Journal of Robotic Systems, Special Issue on Mobile Robots, Vol. 14, 231-249, 1996.
[18]�� Zou, Y., Chakrabarty, K., �Sensor Deployment and Target Localization Based on Virtual Forces,� Dept. of EE & CE, Duke University, Durham, NC, 2003.
[19]�� Hespanha, J.P, Kim, H.J., Sastry, S., �Multiple-Agent Probabilistic Pursuit-Evasion Games,� Proceedings of the 38th Conference on Decision and Control, 1999.
[20] Hynes, S.� "Multi-Agent Simulations (MAS) for Assessing Massive Sensor Coverage and Deployment."� M.S. thesis, Naval Postgraduate School, Monterey, CA, September 2003, www.cs.nps.navy.mil/people/faculty/rowe/HynesThesis.htm.
[21]�� Clouqueur, T., Ramanathan, P., Saluja, K.K., Wang, K., �Value-Fusion Versus Decision-Fusion for Fault-Tolerance in Collaborative Target Detection in Sensor Networks,� Fusion 2001 Conference, 2001.
[22]�� Axelrod, R., The Complexity of Cooperation:� Agent-Based Models of Competition and Collaboration.� Princeton, NJ:� Princeton University Press, 1997.
[23]�� Ulrich, I., Borentstein, J., �VFH*: Local Obstacle Avoidance with Look-Ahead Verification,� 2000 IEEE International Conference on Robotics and Automation, San Francisco, CA, 2505-2511, 2000.
CPT Sean Hynes has a B.S. from the University of Florida (1997) and an M.S. from the Naval Postgraduate School (2003).� Neil C. Rowe is Professor of Computer Science at the Naval Postgraduate School where he has been since 1983.� He is the author of 100 technical papers and a book.� Contact them as sehynes@nps.navy.mil and ncrowe@nps.navy.mil.