REPORT DOCUMENTATION PAGE
|
Form Approved OMB No. 0704-0188
|
|
Public
reporting burden for this collection of information is estimated to average 1
hour per response, including the time for reviewing instruction, searching
existing data sources, gathering and maintaining the data needed, and
completing and reviewing the collection of information. Send comments
regarding this burden estimate or any other aspect of this collection of
information, including suggestions for reducing this burden, to Washington headquarters Services, Directorate for Information Operations and Reports, 1215 Jefferson Davis Highway, Suite 1204, Arlington, VA 22202-4302, and to the Office of Management
and Budget, Paperwork Reduction Project (0704-0188) Washington DC 20503.
|
|
1.
AGENCY USE ONLY (Leave blank)
|
2. REPORT DATE
|
3. REPORT TYPE AND DATES
COVERED
Master's Thesis
|
|
4. TITLE AND SUBTITLE: Comparisons
of Attacks on Honeypots with Those on Real Networks
|
5.
FUNDING NUMBERS
|
|
6.
AUTHOR(S) Binh T. Duong
|
|
7.
PERFORMING ORGANIZATION NAME(S) AND ADDRESS(ES)
Naval Postgraduate School
Monterey, CA 93943-5000
|
8. PERFORMING ORGANIZATION REPORT NUMBER
|
|
9. SPONSORING /MONITORING AGENCY NAME(S) AND
ADDRESS(ES)
N/A
|
10. SPONSORING/MONITORING
AGENCY REPORT NUMBER
|
|
11.
SUPPLEMENTARY NOTES The views
expressed in this thesis are those of the author and do not reflect the
official policy or position of the Department of Defense or the U.S.
Government.
|
|
12a.
DISTRIBUTION / AVAILABILITY STATEMENT
Approved
for public release; distribution is unlimited
|
12b.
DISTRIBUTION CODE
|
|
13.
ABSTRACT (maximum 200 words)
Honeypots are computer systems deliberately
designed to be attack targets, mainly to learn about cyber-attacks and
attacker behavior. When implemented as part of a security posture, honeypots
also protect real networks by acting as a decoy, deliberately confusing
potential attackers as to the real data. The objective of this research is
to compare attack patterns against a honeypot to those against a real
network, the network of the Naval Postgraduate School. Collection of
suspicious-event data required the implementation and setup of a honeypot, in
addition to the installation and use of an intrusion-detection system. A
statistical analysis was conducted across suspicious-event data recorded from
a honeypot and from a real network. Metrics used in our study were applied
to the alerts generated from Snort 2.4.3, an open-source intrusion detection
system. Results showed differences between the honeypot and the real network
data which need further experiments to understand. Both the honeypot and the
real network data showed much variability at the start of the experiment period
and then a decrease in the number of alerts in the later period of the
experiment. We conclude that after the initial probing and reconnaissance is
complete, the vulnerabilities of the network are learned and therefore fewer
alerts occur; but more specific signatures are then aimed at exploiting the
network.
|
|
|
15. NUMBER OF PAGES
73
|
|
16. PRICE CODE
|
|
17. SECURITY
CLASSIFICATION OF REPORT
Unclassified
|
18. SECURITY CLASSIFICATION OF THIS PAGE
Unclassified
|
19. SECURITY CLASSIFICATION OF ABSTRACT
Unclassified
|
20. LIMITATION OF ABSTRACT
UL
|
|
|
|
|
|
|
|
NSN 7540-01-280-5500 Standard Form 298
(Rev. 2-89)
Prescribed
by ANSI Std. 239-18
THIS PAGE INTENTIONALLY LEFT BLANK
Approved for public release; distribution is unlimited
COMPARISONS
OF ATTACKS ON HONEYPOTS
WITH THOSE ON REAL NETWORKS
Binh T. Duong
Civilian, Naval Postgraduate School
B.S., Cal State University, Long Beach, 2001
Submitted in partial fulfillment of the
requirements for the degree of
MASTER OF SCIENCE IN COMPUTER SCIENCE
from the
NAVAL POSTGRADUATE SCHOOL
March 2006
Author: Binh T.
Duong
Approved by: Neil
C. Rowe, Ph.D.
Thesis Advisor
J.D. Fulp
Second Reader
Peter J. Denning, Ph.D.
Chairman, Department of Computer
Science
THIS PAGE INTENTIONALLY LEFT BLANK
ABSTRACT
Honeypots are computer systems deliberately designed to
be attack targets, mainly to learn about cyber-attacks and attacker behavior. When
implemented as part of a security posture, honeypots also protect real networks
by acting as a decoy, deliberately confusing potential attackers as to the real
data. The objective of this research is to compare attack patterns against a
honeypot to those against a real network, the network of the Naval Postgraduate School. Collection of suspicious-event data required the implementation and
setup of a honeypot, in addition to the installation and use of an
intrusion-detection system. A statistical analysis was conducted across
suspicious-event data recorded from a honeypot and from a real network.
Metrics used in our study were applied to the alerts generated from Snort
2.4.3, an open-source intrusion detection system. Results showed differences
between the honeypot and the real network data which need further experiments
to understand. Both the honeypot and the real network data showed much
variability at the start of the experiment period and then a decrease in the
number of alerts in the later period of the experiment. We conclude that after
the initial probing and reconnaissance is complete, the vulnerabilities of the
network are learned and therefore fewer alerts occur; but more specific
signatures are then aimed at exploiting the network.
THIS PAGE INTENTIONALLY LEFT BLANK
TABLE OF CONTENTS
I. introduction........................................................................................................ 1
II. background.......................................................................................................... 3
A. honeypots................................................................................................... 3
B. Intrusion-detection
systems......................................................... 5
1. Snort 2.4.3............................................................................................. 6
a. Inner
Workings of Snort 2.4.3................................................. 6
C. Survey
of related work.................................................................... 9
1. Effectiveness
of Honeypots................................................................. 9
III. Testbed setup,
configuration, and Rationale............................... 11
A. Experiment
specification............................................................... 11
1. Hardware
Specification...................................................................... 11
2. Software
Specification........................................................................ 12
3. Network
Configuration....................................................................... 15
4. Problems
Encountered........................................................................ 16
B. The
school network.......................................................................... 17
1. Hardware/Software
Specification....................................................... 17
2. Network
Configuration....................................................................... 17
3. Problems
Encountered........................................................................ 18
IV. Data results and
evaluation................................................................... 21
A. honeypot
data analysis................................................................... 21
1. Distribution
of Alerts.......................................................................... 21
a. Alerts
over Entire Collection Period..................................... 21
b. Alerts
Compared by Week...................................................... 22
c. Alerts
by Hour......................................................................... 23
2. Distribution
of Classification.............................................................. 25
3. Distribution
of Signatures.................................................................. 29
B. school
network data analysis.................................................. 32
1. Distribution
of Alerts.......................................................................... 32
a. Alerts
over Entire Collection Period..................................... 32
b. Alerts
by Hour......................................................................... 33
2. Distribution
of Classification.............................................................. 34
3. Distribution
of Signatures.................................................................. 35
C. comparison
of honeypot data to real network data. 36
V. Conclusion and
Future work.................................................................. 37
A. conclusion............................................................................................... 37
B. Future
work............................................................................................ 37
appendix a. startup instructions.................................................................... 39
A. step-by-step
startup instructions............................................ 39
1. Instructions
for Starting Honeypot Machine.................................... 39
2. Instructions
for Starting Data-Capture Machine.............................. 39
3. Instructions
for Starting Router Machine......................................... 40
appendix B. Details of Lab Experiment.......................................................... 43
A. Router
configuration..................................................................... 43
1. Details of
Necessary Files................................................................. 43
2. Options and
Details for Apache Script.............................................. 43
3. Options and
Details of Oinkmaster Script........................................ 43
4. Options and
Details of PostgreSQL Interactive Terminal............... 44
a. Sending Query Results to a File.............................................. 44
5. Options and
Details of Snort Script................................................... 45
B. Data-capture
configuration....................................................... 46
1. Details of
Necessary Files................................................................. 46
2. Options and Details of PostgreSQL Script........................................ 46
C. How
to setup odbc connection to nps network.............. 47
appendix C. additional graphs........................................................................... 49
A.
Classification analysis................................................................. 49
LIST OF REFERENCES...................................................................................................... 55
INITIAL DISTRIBUTION LIST...........................................................................................57
LIST OF FIGURES
Figure 1. Snort Architecture............................................................................................... 7
Figure 2. Snort Process of Detecting Suspicious Data......................................................... 8
Figure 3. Snort Database Structure [13]........................................................................... 14
Figure 4. Experiment Network Configuration.................................................................... 15
Figure 5. School's Network Configuration........................................................................ 18
Figure 6. Honeypot Time Plot of Distribution of
Alerts...................................................... 22
Figure 7. Honeypot Box Plot by Week............................................................................. 23
Figure 8. Honeypot Alerts by Hour per Week.................................................................. 24
Figure 9. Honeypot: Frequency of Classification................................................................ 27
Figure 10. Honeypot: Alert Class Percentage over Time...................................................... 28
Figure 11. Honeypot: Alert Class Percentage without
Protocol-Command Decode.............. 28
Figure 12. Honeypot: Frequency of Alert Signature
Category............................................. 29
Figure 13. Honeypot: Individual Frequency of Alert
Signature Categories............................ 31
Figure 14. School: Time Plot of Distribution of Alerts.......................................................... 33
Figure 15. School: Alerts by Hour...................................................................................... 34
Figure 16. School: Frequency of Alert Classification............................................................ 35
Figure 17. School: Frequency of Alert Signature
Category.................................................. 36
Figure 18. Honeypot Classification Legend......................................................................... 49
Figure 19. Honeypot Classification: Jan. 29 – Feb............................................................... 50
Figure 20. Honeypot Classification: Feb. 05 – Feb. 11........................................................ 50
Figure 21. Honeypot Classification: Feb. 12 – Feb. 18........................................................ 51
Figure 22. Honeypot Classification: Feb. 19 – Feb. 25........................................................ 51
Figure 23. Honeypot Classification: Feb. 26 – Mar. 04....................................................... 52
Figure 24. Honeypot Classification: Mar.05 – Mar. 11........................................................ 52
Figure 25. Honeypot Classification: Mar.12 – Mar. 18........................................................ 53
THIS PAGE INTENTIONALLY LEFT BLANK
LIST OF TABLES
Table 1. Default Ruleset for Snort 2.4.3............................................................................. 9
Table 2. Experiment Hardware Specification.................................................................... 12
Table 3. Experiment Software Specification..................................................................... 14
Table 4. Metrics Used in Honeypot Analysis.................................................................... 21
Table 5. Honeypot: Summary of Numbers of Snort
Alerts................................................ 23
Table 6. Snort Alert Categories....................................................................................... 26
Table 7. Snort Alert Counts by Type Compared
for Two Successive 13-day Periods....... 32
Table 8. Essential Files of the Router Machine................................................................. 43
Table 9. Essential Files of the Data-Capture
Machine....................................................... 46
THIS PAGE INTENTIONALLY LEFT BLANK
ACKNOWLEDGEMENTS
I would like to thank Reese Zomar and the Naval
Postgraduate School Network Security Group for providing the necessary data. I
would like to extend a very special thank you to Charles Herring and Ryan Self
for all their technical support and advice. I greatly appreciate their
gracious attitude and patience.
Special thanks to my thesis advisor, Professor Neil Rowe
and his colleague John Custy for their assistance and guidance. Thank you to
Professor Richard Harkins for providing the laboratory space and equipment.
Last but not least, thank you to my partner, Glenn
Fukushima. Without his support, none of this would have been possible.
This material is based upon work supported by the
National Science
Foundation under Grant No. DUE-0114018. Any opinions, findings, and conclusions
or
recommendations expressed in this material are those of the author
and do not necessarily reflect the views of the National Science Foundation.
THIS PAGE INTENTIONALLY LEFT BLANK
Cyber-attacks are a serious problem that resulted in over
$130 million in losses according to the 2005 CSI/FBI Computer Crime and
Security Survey [1]. As indicated in their survey, virus attacks and
unauthorized access led as the primary sources of financial loss. An important
security technology used to combat and understand these cyber-attacks is the
use of a honeypot. A honeypot is a form of deception employed to detect or
confuse unauthorized attempts on information systems. Honeypots have no
productive value; therefore any interaction captured is deemed unauthorized.
This makes honeypots a powerful technology for gathering and understanding
information on threats.
The objective of this thesis is to distinguish attack
patterns against a honeypot from those against other kinds of computers.
Varying the degree of deception on our honeypot, we conduct a statistical
analysis of suspicious-event data collected from our high-interaction honeypot
and that from data collected from our School's internal network. A
high-interaction honeypot is defined as a network of computers using real
operating systems and services, whereas a low-interaction honeypot is software
installed that emulates different operating systems and services. Typically,
low-interaction honeypots have limited interactions, while high-interaction
honeypots are more complex, therefore providing more data to be captured [2].
With these techniques we hope to measure the effectiveness of a honeypot by
providing similarities and/or differences of the attack pattern under different
configurations using various metrics. In general, the goal of our research is
to test the value of defensive deception for a computer system, and to describe
and characterize the impact of deception when used on honeypots.
The
setup of the experiments reported here includes the installation and
configuration of a honeypot and intrusion-detection system. We collect and
extract data from our honeypot and from the School's network. We evaluate the
data collected and propose metrics to better analyze the suspicious-event
data. Based on these metrics, we model trends and compare them between the
honeypot and the School's internal network. Metrics used in our study derive
from alerts generated from Snort, an open-source intrusion-detection system.
An intrusion-detection system is hardware and/or software that are used to
detect inappropriate or suspicious activity. Specifically, Snort produces
alerts by identifying signatures of suspicious traffic.
The purposes of a honeypot are for production or for
research [2]. When used for production purposes, honeypots help prevent and
detect attacks for those organizations as part of their defense posture. The
purpose of our study is for research. We are not interested in capturing information
on new tools or analyzing the communication method of the attacker but rather
on the patterns of the suspicious-event data. We want to understand the
effectiveness and weaknesses of honeypots. In addition, we want to find good
metrics so that the massive amount of data is filtered so it can be effectively
and systematically analyzed and correlated.
The background of the key tools of the thesis such as
honeypots and intrusion-detection systems along with the survey of related work
is described in Chapter II. Chapter III details the testbed setup,
configuration, and rationale of the honeypot including hardware, software and
network details. In addition, a brief description of the School's network is
provided, including specification of its hardware and network configuration.
The data analysis is described in Chapter IV. Chapter V provides conclusions
and suggestions for future work. Appendix A details startup instructions of
the honeypot, database, and intrusion-detection system. Appendix B details
additional options and necessary files of the lab experiment. Appendix C
provides additional graphs used in the data analysis of the honeypot.
II. background
This chapter provides background related to our study.
The first section is a history and overview of honeypots and their use as a
decoy system or a form of deception. The second section is an introduction to
intrusion-detection systems and the use and inner workings of Snort, the one we
used. The third section is a survey of related work in the area of honeypot
effectiveness.
A. honeypots
The concept of honeypots has been around since before the
invention of computers. This concept involves a decoy computer system for
which interactions are solicited. The honeypot owner's purpose is to observe
this interaction in hopes of gaining a better understanding of those entities
interacting with the deception. In the context of the cyber world, we define a
honeypot as "an information system resource whose value lies in unauthorized or
illicit use of that resource." [2]
The popularity of honeypots has greatly increased over
the last few years. The concept first surfaced in 1989 in Cliff Stoll's "The
Cuckoo's Egg". It was not until the formation of the Honeynet Project in
October 1999 that the concept was better formulated and organized as a way to
learn more about the "blackhat" community, their tools, and their
techniques. (A "blackhat" is a malicious person or hacker who
compromises the security of the system to gain unauthorized access to the
computer and/or network [3].) Founding members of the Honeynet Project were
Marty Roesch, Chris Brenton, J.D. Glazer, Ed Skoudis and Lance Spitzner. They
would learn about hackers through honeypots or honeynets and share the
knowledge through their website and publications. In just a few years,
interest in learning about the blackhat community greatly increased. With the
explosion of technology, computer use, and the need for better security
measures, the Honeynet Project would eventually reach its limit. Enter the
Honeynet Research Alliance in January 2002, which consists of different organizations
across the world facilitating the learning and sharing of knowledge through the
deployment of honeynets.
The main kinds are low-interaction honeypots and
high-interaction honeypots. Low-interaction honeypots, or shallow decoys,
emulate services [2, 4]. They are typically easier to deploy than
high-interaction honeypots, require less administrative expertise, and less
resources. Both an advantage and disadvantage of a low-interaction honeypot is
that it limits the amount of interaction; while this minimizes the risk of what
an attacker can do, it also limits the amount of data that is collected. In
addition, low-interaction honeypots "cannot properly mimic the response of real
services or determine activity after a compromise"[4]. High-interaction
honeypots, on the other hand, are deployed with real operating systems and
actual services. They can generate an extensive amount of data. Observing attackers
exploiting services and operating system vulnerabilities, we discover new tools
used, learn about motives, and capture unexpected behavior [2]. The
disadvantage to high-interaction honeypots is the added level of complexity and
risk. They require more setup time, more monitoring time, more administrative
expertise, and more resources to build and configure the specified operating
system and services. Note that to prevent discovery of both kinds of honeypots
by attackers during reconnaissance, deception is crucial. This could mean
writing more elaborate scripts for low-interaction honeypots or customizing
high-interactions honeypots. We used a high-interaction honeypot in the
experiments reported in this thesis.
The risk of using a high-interaction honeypot can be
significant. Potentially, an unmonitored honeypot can foster criminal activity
by allowing storage and/or distribution of illegal materials, such as stolen
credit card account numbers. Compromised honeypots can also launch attacks on real
computers or networks. Therefore there are two criteria to minimize risk and
maximize success: data control and data capture [2]. Data control involves
restricting malicious activity to the perimeter of the honeypot; this can be
done by limiting the outbound connections. Data capture involves monitoring
and logging all interactions. By doing so, criminal activity can be prevented
if noticed early enough by disabling the honeypot when suspect activities, such
as increased inbound/outbound connections or transfer of files, occur; but this
takes effort, time and expertise. Real-time monitoring and analysis of the
captured data is itself an intensive and laborious task and must not be taken
lightly. In addition, there must be careful consideration as to where and how
the data is logged. Logging the data locally increases the risk of detection
or worse tampering or corruption of the captured data. "Captured data must be
logged and stored on a separate, secured system."[2].
Honeypots have several other uses besides monitoring
attackers. They serve to protect real networks and their data by acting as a
decoy, deliberately confusing potential attackers. A special kind of honeypot
called a "sticky honeypot" aids in slowing down attackers or automated
worms. Honeypots also allow security administrators to discover and remedy
weaknesses in the software and configuration of a host or network. Their
flexibility fits the dynamic nature of the cyber world.
An intrusion-detection system (IDS) is software that
detects inappropriate or suspicious activity on a computer or network.
Intrusion is defined as any unauthorized access to a network, computer or
file. In addition to intrusion however, misuse (inappropriate activity) should
be detected and logged by an IDS. We further identify three types of IDSs:
host-based, network-based, and distributed. A host-based IDS resides on a
single computer and protects just that computer; it monitors the operating
system and detects modifications to files residing on the host system. A
network-based IDS can monitor more than one computer and is placed in a
network; its "sensors" examine packets as they transit the network.
This is done by typically setting the Network Interface Card of a dedicated
computer on the network to "promiscuous mode". The third type of IDS
is a distributed IDS, which can combine both host-based IDSs and network-based
IDSs; suspicious events from a set of IDSs are reported to a central database
system [5]. Our testbed employed a centralized network-based IDS.
IDSs are further distinguished by how the inappropriate
activity is detected. The two approaches are anomaly-based and signature-based
(or rule-based) detection. Anomaly detection characterizes normal behavior and
develops a profile of what is "normal"; suspicious activities are
deviations from this profile. An example anomaly-based IDS is Stealth Watch [6].
Signature-based detection, uses a knowledge base of specific data (often bit
strings) characteristic of previously identified attacks. Detection of
suspicious activities occurs when a known signature and a packet match. An
example of a signature-based IDS is Snort, although it contains some
anomaly-based detection features. For our testbed, we deployed Snort version
2.4.3.
"Snort® is an open source network intrusion
prevention and detection system utilizing a rule-driven language, which
combines the benefits of signature, protocol and anomaly based inspection
methods. With millions of downloads to date, Snort is the most widely deployed
intrusion-detection and prevention technology worldwide and has become the de
facto standard for the industry."[7]
Snort is the default standard for intrusion detection. We
also deployed it because we desired a similar data format to that obtained from
the Network Security Group of the Naval Postgraduate School. They use Snort to
monitor the school's network and graciously offered samples of their data and
Snort rules for our research.
We briefly discuss the Snort architecture and how attacks
are detected. An important requirement of running Snort is the libpcap library
for Linux systems or WinPcap for Windows systems; this library does packet
capture. Figure 1 is a high-level outline of the Snort architecture in
relation to the TCP/IP Model.
align=center style='text-align:center;

Figure 1. Snort Architecture
The layer at which the packets are passed from host to
host is at the datalink layer. The packet-capture library reads the packets at
this point so that the Snort engine can decode, detect, and alert as
necessary. Once the libpcap/WinPcap captures a packet, the following occurs [5]:
1)
The Packet decode engine decodes the packet based on the link
layer protocol (e.g. Ethernet, Token Ring, or PPP).
2)
The Preprocessor plug-ins handle the packets after the decoder
has parsed them, by reassembling packets, decoding protocols, and doing
anomaly-based detection.
3)
The Detection Engine is where packets are matched to rules to
detect suspicious behavior. By using a multi-pattern search algorithm, the
detection engine checks multiple rules in parallel.
4)
Detection plug-ins implements specialized tests.
5)
Finally, if alerts are generated, then the Output plug-in is
called. This allows for various formatting and presentation of these alerts.
Supported plug-in formats include UNIX syslogs, XML-formatted logs, and logging
to relational databases such as Oracle, MySQL, or PostgreSQL.
Figure 2 shows an incoming packet and the process
involved before and after the Snort engine detects the suspicious-event data. The
rule shown is designed to catch a UDP bomb attack. The alert is triggered when
the detection engine matches UDP packets going from any source IP address to
any destination IP address, from port 19 to port 7 [5].

Figure 2. Snort Process of Detecting Suspicious Data
The rule set ("knowledge base") used by Snort
in examining packets is stored in a directory of text files. Each text file is
a ruleset; each ruleset contains a list of rules similar to that of the UDP
bomb attack. It is important that one frequently update the rules so that new
attacks are captured and properly alerted. The default Snort package includes
a rulebase with the rulesets shown in Table 1.

Table 1.
Default Ruleset for Snort 2.4.3
Rules can also be downloaded from the Snort website at www.snort.org
from the Sourcefire Vulnerability Research Team (VRT). Unregistered users can
obtain a static ruleset at the time of a major Snort Release. Registered users
can download rules five days after a release to the subscription users.
Subscribers can download real-time rules as soon as they are available.
However, subscribers pay a fee of $195/month or $495/quarter or $1795/year. In
addition, Snort provides administrators with the flexibility and ease of
creating their own rules.
Some have defined the effectiveness of a honeypot by two
measures: the ability to deceive and the ability to solicit attacks. In [4]
the authors compare the effectiveness of two low-interaction honeypots,
Deception Toolkit (DTK) and Honeyd. They measure the effectiveness of the
deception by determining the difference between the behavior of the honeypot to
the behavior of real services. The effectiveness of the solicitation is
measured by the number of unique responses that are solicited from the
attacking program. A lab was setup to perform a series of anomaly scripts and
known attacks. The known attacks included different types of malware.
Automated scanners and auto-rooters were examples of a ‘Category III' attack
used in the experiment. A paradox occurred in the results of the experiment.
Although the low-interaction honeypots did not deceive well according to their
tests, they did however receive more attacks from automated scanners and
auto-rooters than real systems did. This is an important conclusion. Many
systems attract common script kiddies or automated worms, botnets, and auto-rooters
[8]. The ability to solicit attacks aids the effectiveness of honeypots as it
increases the amount of data that is collected. We also conclude that the type
of traffic that honeypots receive can depend on the type of deployment, i.e.
low-interaction vs. high-interaction. Although, both low-interaction and
high-interaction honeypots are effective in soliciting attacks,
high-interaction honeypots have a better potential of improving the
effectiveness of deception. In high-interaction honeypots, we are not
emulating services but in fact, implementing real services. The only
limitation is in our own ability to properly and creatively configure and
deploy such systems. As such, there is this opportunity and if done properly
increases the chance of soliciting attacker activity in addition to the
automated worms and botnets.
One of the most active
research groups contributing to the technology of honeypots is The Honeynet
Project [9]. This project has grown into a community of organizations dedicated
to learning about attacks, tools, and attacker motives. But as the honeynet
technology advances, so do attackers' abilities. In a counterfeit issue of an
online hacker periodical, one of the Honeynet Project's data-capture tools,
Sebek was criticized. Although the periodical was a hoax, some noteworthy
points are made, such as that honeynet technology can be detected. In a
rebuttal article [10] the author points out that honeynet technology is
continually improved with the advancement of countermeasures by hackers, since
there are counter-countermeasures. In regards to detection, "the action of
checking for a honeypot can give a detectable signature, leading to new, more
specific techniques for detection"[10].
This chapter details the hardware, software and layout of
the honeypot network ("honeynet") used in collecting data, and the
problems encountered in setting up the experiment. Also discussed is the
general layout and configuration of the School's network.
We deployed a high-interaction honeypot, setting up a
small network of computers. An IP address was registered from SBC Internet
Services so that direct connection to the Internet was possible.
Three computers were provided in the experiment and were
networked together via crossover cable. The other computers, as indicated in
Figure 3, were virtual computers implemented inside one specific computer
running special software. Each computer was specifically tasked and labeled.
The resulting network comprised of the Router, the Honeypot, and the
Data-Capture computers. The Router's purpose was to act as the portal from the
outside world to the Honeypot while collecting data. Therefore we installed
three network interface cards (NICs). The NIC connecting to the Internet was
set to promiscuous mode so that packets could be sniffed. The remaining two
NICs connected the other machines. One NIC was designated to the Honeypot,
while the other transferred data to the Data-Capture machine. The Honeypot
machine served as the sacrificial information resource which solicited
attacks. The deployment of the Honeypot included running a virtual network of
two computers with various services. The Data-Capture computer served to log
and to store the captured data. The hardware specifications of each system are
listed in Table 2.

Table 2.
Experiment Hardware Specification
SUSE Linux 10 was installed on each computer. Other
software was added in accordance to the task of each computer. Installed on
the Router machine is the intrusion-detection system, Snort 2.4.3, Apache
Webserver, and Basic Analysis and Security Engine (BASE). The
intrusion-detection system or Snort sensor serves to sniff inbound and outbound
traffic to the honeypot and to send any captured data to the Data-Capture
machine. Apache Webserver is an open-source Web server needed to run BASE.
BASE is an application that provides a web front-end to query and analyze the
alerts coming from Snort. Installed on the Honeypot box was VMware Workstation
5.5. VMware is a commercial software that allows for the creation and
execution of multiple operating systems simultaneously on a single physical
machine [11]. Using VMware allowed for the option of growing our network
into a more extensive honeynet. Since we were limited to one machine, VMware
allowed us to do so, simulating two additional operating systems.
The initial environment on the Honeypot had one guest
operating system installed on the VMware, Microsoft Windows 2000 Advanced
Server with Service Pack 4, the most recent Service Pack. We opted to use
Service Pack 4 because we realized that Service Pack 1 was too vulnerable to
autonomous agents such as bots and worms. We wanted our high-interaction
honeypot to appear more like a legitimate network on which system
administrators would install the latest service patch and updates. We also
installed a Windows XP Professional with Service Pack 2, upgrading our honeypot
to a honeynet. Services running on Windows 2000 Server included Internet
Information Service (IIS) 5.0, FTP and Telnet. Internet Information Services
is Microsoft's Web server application which provides users with a manageable and
scalable Web application infrastructure [12]. Our setup contained a simple Web
page consisting of photographs. In addition, we added a shared folder and
placed text files and word documents inside. One group and two users were
added to each of the Windows machine. We also installed AOL Instant Messenger
(AIM), is a free instant messaging service on our Windows XP machine. We setup
an account and configured AIM to start at boot-up.
The Data-Capture box was purposely segregated on a
separate subnet than that of the Honeypot. Information obtained from the
Router was directed to the Data-Capture box and stored on a database. We used
PostgreSQL 8.1.1, an open-source relational database system. Rather than log
alerts into files, we anticipated a high volume of traffic and therefore wanted
the ability to easily access and view in real time the captured data. Using a
database provided us with the categorization and querying benefits needed to
efficiently filter the output to suit our needs. By using the database plug-in
made available by the Snort intrusion-detection system, alerts are quickly
"sorted, searched and prioritized in an organized manner" [13]. Presented in
Figure 3 is an overview of the database structure and their relationships.
Most tables include just the primary-keys field. There are additional fields
not shown for each table.
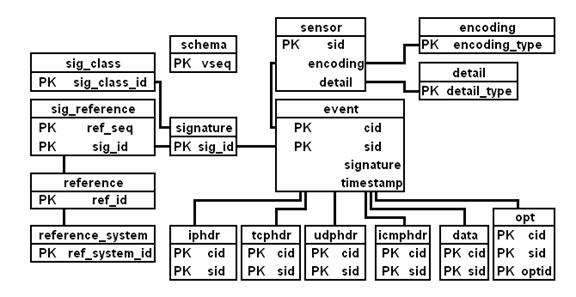
Figure 3. Snort Database Structure [13]
The event table is the main focus of the database
structure. It represents the meta-data of all detected alerts captured from
our Router to and from our Honeypot machine. The signature and sig_class
tables are also important in determining the type of signatures and
classifications of each alert.
The software specifications of each system are listed in
Table 3.

Table 3. Experiment Software Specification
The Naval Postgraduate School provided an Internet
connection outside the School's firewall. By putting our network outside the
firewall, we hope to see more attacks while protecting the School's internal
network. The Router machine contains three NICs. One NIC is connected to the
Internet. The second NIC connects from the Router to the Honeypot machine.
The third NIC connects to the Data-Capture machine. The Honeypot and
Data-Capture machines are on separate subnets. The network configuration is
presented in Figure 4.

Figure 4. Experiment Network Configuration
Problems and issues were caused by limited resources and
a lack of familiarization with Linux and the other applications. Much of the
hardware was scrounged from obsolete computers retired from the
computer-science and software-engineering departments. We were able to cull
various parts such as hard drives, RAM, and NICs to build two functional
computers. We decided to dedicate the newer and fastest computer to the
Honeypot because of the need to run VMware and to use the other computers to
route and collect data.
We also had to scrounge for software. Our choices were
between using retired software and shareware. Through the generosity of the
networking group of the Naval Postgraduate School we were able to obtain a copy
of Microsoft Windows 2000 Advanced Server. Other software such as SUSE Linux
10, Snort 2.4.3 and PostgreSQL were open-source. We had originally installed
Redhat Linux 9.0 on the two older computers but ran into a strange error
message when attempting to install this version of Linux onto the newest
computer. After doing some research, we discovered that the newer computer
included a serial-ATA (SATA) hard drive that was not compatible with the older
Linux kernels. Online advice suggested that we use a newer Linux kernel and
therefore we obtained a copy of SUSE Linux 10 and re-installed. This led to
our next problem. We originally attempted to install VMware 5.0 onto our
Honeypot but realized that version 5.0 was not supported on SUSE Linux 10.
Fortunately, we were able to upgrade to VMware 5.5 and completing the
installation onto the Linux box was unproblematic.
A significant part of this project was in learning to use
Linux. For those trained on Windows where much installation and configuration
is aided with GUI, Linux initially was intimidating. Installation of a program
was no longer double clicking an executable, but understanding the commands
"configure", "make", and "make install". In
addition, Linux meant a world of dependencies and more often than not,
installing a program meant finding, downloading, and installing several other
programs or libraries. There was a learning curve.
The School's network layout and specification is far more
complex since it must support nearly 1,500 students and over 600 faculty and
staff members.
The NPS network serves to connect students, educators and
staff both internally and externally to the Internet. There are numerous
hardware equipment including workstations, servers, and printers disbursed
throughout the campus. Most faculty and staff have their own workstation
running various operating systems like Microsoft Windows and/or a UNIX
variant. In addition, the academic buildings provide students with
laboratories running Microsoft Windows in which to complete assignments and
research. Various software is installed at each laboratory on each workstation.
The School deploys two intrusion-detection systems,
StealthWatch and Snort. We are concerned here only with the captured data from
Snort. Currently, there are two Snort sensors. Sensor 1 is placed in front of
the firewall, capturing all packets bound to the school, whether blocked or
allowed by the firewall. The other sensor is placed behind the firewall,
monitoring internal traffic. Sensor 2 captures all allowed inbound traffic and
all blocked or allowed outbound traffic. Both sensors record successful
connection, therefore some events are logged twice. All captured data is sent
to a secure server running Microsoft SQL Server 2000 database.
To obtain the School's captured data, we created an ODBC
connection. Open Database Connectivity (ODBC) is an application programming
interface that provides access to various types of databases. The School
provided our research with read-only access to the SQL Server database storing
the Snort data. (See section C of Appendix B for detail instructions on how to
create an ODBC connection.)
Figure 5 is an overview of the School's network
configuration. The captured data provided to us by the school is from Snort
sensor 1.
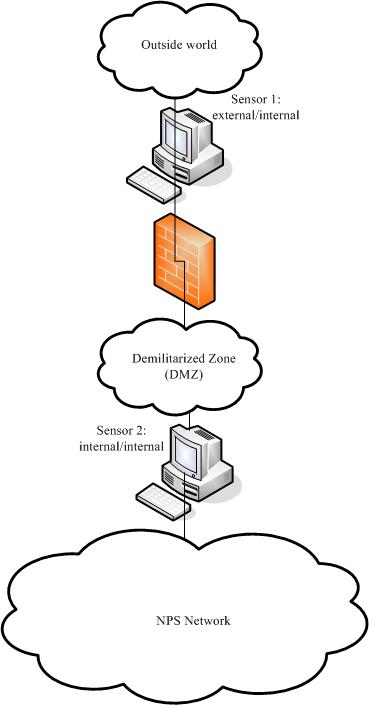
Figure 5. School's Network Configuration
At the time of our experiment setup, the NPS Network
Security Group was going through some major changes. The change that affected
our research was the staff change involving the lead security engineer. His
insight and expertise was pivotal in understanding the network layout and
resolving most of our issues in a timely manner. Shortly after his departure
from NPS, the server containing all the archival Snort data crashed. The
server was sent to a data recovery facility; three months later, we were informed
that the data could not be recovered from the server. The Network Security
Group then put much effort into rebuilding the server and reinstalling and
reconfiguring Snort. During the time of this writing, about two weeks of data
was accumulated, although we would have liked more. This data is used in our
analysis.
THIS
PAGE INTENTIONALLY LEFT BLANK
IV. Data results and evaluation
Collection of suspicious-event data from our honeypot was
done January 29, 2006 through March 18, 2006. The alerts were collected daily and then accumulated on a week-by-week basis, starting from Sunday and
ending on Saturday. The last two weeks are the only period with an overlap to
data of the School's network. The metrics used in our analysis is presented in
Table 4.
Table 4.
Metrics Used in Honeypot Analysis
We first show the
distribution of alerts over the entire seven week experiment in a time plot.
Figure 6 represents all the generated alerts triggered and recorded by our
Data-Capture machine for a given day. The number of alerts varied widely, especially
during the first half of the collection period with spikes on January 31st,
February 6th, and February 22nd of 8,987, 11,381, and 11,067 respectively. In
the latter half of the collection period the alerts appear to subside but again
spike on March 5th and March 9th, with 3,786 and 4,516 alerts respectively. This
plot provides us with a good sense of the volatility of the Internet and the
incoming alerts, and in particular its non-Poisson "bursty" nature.
This unpredictability makes expressing the probability of a number of alerts
for a fixed time unfeasible.

Figure 6.
Honeypot Time Plot of Distribution of Alerts
Based on the tabulations of Table 5, we present boxplots
of each week as shown in Figure 7. Here, we are provided with a measure of the
spread of the middle 50% of the alerts for each week. Easily notable are the
extreme values presented in the boxplot. The maximum number of alerts are the
outliers for the weeks presented. In addition, the interquartile ranges (IQR)
of week 2 and week 4, (4,873 and 3,981 respectively) about nearly double over
the other weeks. This is an indication of less consistency for those
particular weeks. Something else apparent is that the alerts seem to be
subsiding in the latter half of the collection: From week 4 on, there are fewer
alerts reported. Looking at the boxplot, there is a dotted line running over
the spread of the alerts. The distribution is skewed to the right indicating
that the majority of alerts came in the beginning of our collection period and
has lessened towards the end.

Table 5.
Honeypot: Summary of Numbers of Snort Alerts

Figure 7. Honeypot Box Plot by Week
Of interest are the alerts generated at specific times in
the day. In Figure 8 we display the number of alerts generated each hour for a
seven-day period for each of the weeks in our collection. We notice the
irregularities of the incoming alerts. Each week has at least one significant
spike. In at least five of the seven weeks, there are spikes early in the
day. For example, in the first three weeks, spikes occurred at the 10 and 6 o'clock hours. With the exception of the week of Feb. 26, alerts subside in the latter
hours of the day, which suggests that most attackers are in North America or
that attacks from zombie computers are local. This also suggests that the
attacks are probably not real attackers or even script kiddies. Attacks at a
constant and specified time indicate that they are more likely automated
botnets or scanners.


Figure 8.
Honeypot Alerts by Hour per Week
All Snort alert rules are given a classification. Our
honeypot data included sixteen of the classifications presented in Table 6
which are highlighted in yellow. The classifications are grouped by priority.
The priority number indicates the severity of the alert, i.e. priority 1 being
the most severe. For more detail on the alerts classification per week, please
see Appendix C.

Table 6. Snort Alert Categories [5]
Figure 9 shows the frequency of alerts generated in each
classification for the collection period. The most common classification with
65.8% is protocol-command-decode. These generated alerts or signatures are
particular to NetBIOS Name Service, in which packets are designated for NetBIOS
TCP and UDP ports 135-139. Our honeynet runs Windows 2000 Advanced Server and
Windows XP where NetBIOS over TCP/IP is enabled. With the numerous
vulnerabilities associated with NetBIOS, we expect a high volume of this class
of attacks.
Figure 9. Honeypot: Frequency of Classification
Figures 10 and 11 show the frequency of alerts generated
in each classification by week. Figure 10 displays the major classifications
that generated alerts per week. Despite the big spike in alerts with
protocol-demand-code, we see a constant oscillation from week to week. Figure
11 is the same graph with the protocol-command-code removed. Classifications
such as unsuccessful-user and network-scan remained constant throughout, while
shellcode-detect and misc-attack showed an increase over time. Network-scan is
part of the Internet noise that is constantly occurring. Attacks that we are
more concerned with and have higher priorities are the shellcode-detect and
misc-attack. The shellcode-detect is a detection of an executable code. There
are numerous malicious codes that spread through exploitation of vulnerable
services. Once these vulnerable services are known, we see an increase of
malicious code targeting our honeynet.
Figure 10. Honeypot: Alert Class Percentage over Time
Figure 11. Honeypot: Alert Class Percentage without
Protocol-Command Decode.
3.
Distribution of Signatures
Seventy-eight different Snort alerts (signature
matchings) were generated over the collection period. The alerts can be
grouped into Snort categories, as for example all ICMP signatures such as ICMP
PING Windows, ICMP PING *NIX, ICMP trace route, etc. were grouped into the
category of ICMP signatures. Figure 12 shows the frequency of signature
classes over our entire collection period. The most common category are
NETBIOS signatures. We expect that with typical packet traffic there are
certain alerts that occur more often than others.

Figure 12. Honeypot: Frequency of Alert Signature Category
Figure 13 shows the individual frequency of
alert-signature categories. The percentage was calculated by totaling the
alerts in a category and dividing by the total number of alerts that week.
Both MS-SQL and SHELLCODE signatures show an increase in alerts over the
weeks. ICMP and SNMP signatures show a significant spike in week 5 and then
suddenly drop, suggesting they are due to different attackers than the other
attacks. The WEB and NETBIOS signatures both oscillate.


Figure 13. Honeypot: Individual Frequency of Alert Signature Categories
In our initial analysis, using only a 26 day period, we
compared data from the first 13 days with that of the last 13 days. We use
clustering to process each new alert by considering all identical alerts within
a 10 minute or less as one single event. Clusters greatly reduce the effect of
one attacker repeatedly trying the same thing. Table 7 shows raw alerts and
clustered generated for each of the snort alert class. As with the MS-SQL
graph from Figure 13, we see an increase in raw alerts as well as an increase
in clusters. Table 7 further breaks down the Web signatures. We see that
WEB-PHP alerts increase while WEB-IIS, WEB-ATTACKS, WEB-FRONTPAGE, and WEB-MISC
decrease. The initial analysis is an indication that our honeypot and its
vulnerabilities are being recognized and thus attack behavior is adjusting
accordingly.

Table 7.
Snort Alert Counts by Type Compared for Two Successive 13-day
Periods.[14]
Collection of suspicious-event data from our school's
firewall was done March 2, 2006 through March 18, 2006. The alerts were collected daily and then accumulated. Only alerts from sensor 1 were collected, which
sits outside the school's firewall and captures all inbound/outbound traffic
blocked or allowed by the firewall. Alerts generated from sensor 1 will
therefore capture any potential attacks.
We first show the distribution
of alerts over the ten day period in a time plot. Figure 14 represents all the
generated alerts triggered and recorded by sensor 1 for a given day. The number
of alerts varied widely, especially during the first few days
because the NPS Networking Group was still in the process of tuning their Snort
sensor. In addition there were no alerts collected for the days of March 11th and 12th, and only partial data on March 10th, 13th,
and 18th.

Figure 14. School: Time Plot of Distribution of Alerts
In Figure 15, we display the number of alerts generated
each hour for the ten-day period. All alerts for the ten days were summed by
the hour. There are two meaningful spikes, one at 10:00 and one at 4:00 o'clock. These suggest that most attackers are on Pacific Standard Time.

Figure 15. School: Alerts by Hour
Figure 16 shows the distribution of classifications
accumulated over the ten-week period. Web-application-activity and bad-unknown
are the most frequent occurring classifications.

Figure 16.
School: Frequency of Alert Classification
One-hundred and forty-two
different alerts in 23 categories were generated over the collection period.
Figure 17 shows the distribution of alert (signature) categories. Since alerts
are being generated by both inbound and outbound connections, we are seeing a variety
of categories not witnessed in the honeypot data. The frequency of signature
categories is related to type of network and the users of this network. In our
case, the users of this network are students; therefore increased traffic is
seen in WEB and INFO-FTP. Other interesting signature categories include PORN
and P2P. P2P type signatures are software applications for peer-to-peer
sharing of data. Specifically, the School's data shows signatures of popular
two popular music sharing software, "Gnutella" and "Kazaa."
Figure 17. School: Frequency of Alert Signature Category
We did not see any significant similarities between the
honeypot and the school's firewall data. This suggests that attackers recognize
the two sites as quite different and use different attacks against each. In
fact, some categories seemed to be negatively correlated, suggesting that
attackers are less likely to launch a particular attack on one site if they are
already doing it on the other. A notable missing category from the school's
data is NETBIOS. Because of the large number of alerts generated in this
category, the school chose to comment out the rule from their Snort
configuration file, i.e. not to generate any alerts for incoming packets
matching the NETBIOS rules. Thus we cannot say whether NETBIOS attacks are
similar on the two sites.
In both the honeypot and school's network, there is much
randomness to the alerts. Despite the noise, we did observe a definite
decrease in the number of alerts on our honeypot over the weeks, and no
decrease on the school's firewall in some of the same time period. It appears
that after the tuning is complete on a honeypot and the deployment is
stabilized, i.e. there is no missing data, that there will be a decrease in
alerts. We conclude that after the initial probing and reconnaissance is
complete, the vulnerabilities of the honeypot are learned and therefore fewer
alerts occur; but more specific signatures are then aimed at exploiting the
honeypot. Of course, the Networking Security Group is constantly monitoring
their alerts; if vulnerabilities are found, the administrators quickly remedy
this breach and therefore, there is stabilization with the number of alerts.
A goal of this thesis was to develop a methodology for
obtaining statistics about cyber-attack trends over time. Therefore, future
work should include running and monitoring of the honeynet system for a longer
period of time. In addition, as attackers, automated
worms, botnets, and auto-rooters evolve, honeypot architecture must also evolve
in its installation and configuration. We must also anticipate that the
honeynet's IP address and its associated architecture, its operating system,
and its services will be learned. After sufficient data has been collected
with the previous setup, a fresh and dissimilar architecture should be
deployed. Differences in architecture should include changes in the number of
operating systems, types of operating systems, and types of services. Again,
this newer deployment should be monitored for a long period of time.
Another goal of the thesis was to present a comparative
analysis of the honeypot data with that of the School's network data. Much
more can be extracted and compared, in particular because we had limited data
from the School.
Finally, we identify issues that could aid in the
advancement of honeynet research:
1.
Extract more metrics on alerts such as, IP source address, source and
destination port numbers, time-to-live values, and types of protocols, and
calculate statistics on these.
2.
Develop a more efficient way of automatically consolidating, clustering,
and analyzing extracted data.
3.
Develop and implement methods to adjust the honeypot data with the
School's data in the same time period.
4.
Using different configurations, try to prove what clues attackers are
responding to during reconnaissance of a honeypot.
.
These are the steps required to start the machines used
in the experiments reported in this thesis. First, the three computers must be
powered on and connected per the Testbed Setup. If computers are powered off,
power on each computer (i.e. Router, Honeypot, and Data-Capture), boot into
SuSE Linux 10.0, and log on.
Once logged onto the Honeypot, perform these instructions
to start VMware and power on the virtual honeynet environment.
1) Open
terminal.
2) At prompt
issue command: vmware.
3) Select Windows
2000 Advanced Server in the Favorites pane on the left of the workstation
window.
4) Click on Power
on this virtual machine.
5) Select Windows
XP Professional 2 in the Favorites pane on the left of the workstation
window.
6) Click on Power
on this virtual machine.
Once logged onto the Data-Capture machine, perform these
instructions to start PostgreSQL database server.
1) Open terminal.
2) Change
directory by issuing command: cd /etc/init.d.
3) Start
PostgreSQL by issuing command: ./postgres start.
(Optional) These instructions allow users to log onto
terminal-based front end to PostgreSQL. Once logged
in, users have the option to type in queries interactively to PostgreSQL and see the query results.
1) Open terminal.
2) Change directory by issuing command:
cd
/usr/local/postgres-8.1-1/bin/.
3) To login into database issue
command:
./psql –h /var/tmp –U
<username> <name of database>.
4) Type in appropriate password when
prompted: <password>.
Once logged onto the Router, perform these instructions
to download the latest rule set and start Snort 2.4.3.
1) Open
terminal.
2) Change
directory by issuing command: cd /etc/cron.daily.
3) Run
oinkmaster script by issuing command: ./oinkmaster.
4) Change
directory by issuing command: cd /etc/rc.d.
5) Start Snort
2.4.3 by issuing command: ./snort
start.
(Optional) These instructions allow users to remotely
log onto terminal-based front-end to PostgreSQL. Once
logged in, users have the option to type in queries interactively, issue
them to PostgreSQL, and see the query results.
1) Open terminal
2) Change directory by issuing command:
cd
/usr/local/postgres-8.1-1/bin/
3) To login into database issue
command:
./psql –h 10.0.0.10 –U
<username> <name of database>
4) Type
in appropriate password when prompted: <password>
(Optional) These instructions start Apache web server
and Basic Analysis and Security Engine (BASE).
1) Open terminal.
2) Change directory by issuing command: cd
/etc/init.d.
3) Start Apache web server by issuing
command: ./apache2
start.
4) Open web browser.
5) In the Location bar type: http://localhost/base/base_main.php.
THIS
PAGE INTENTIONALLY LEFT BLANK
This section details scripts, files and directories
associated with Snort 2.4.3, Apache webserver, BASE, and PostgreSQL. Included
with each section are the additional options of the startup scripts.
Table 8. Essential Files of the Router Machine
Other parameters can be passed to the Apache script.
Users must change directory to /etc/init.d and issue the following
command, ./apache2,
to view additional options. The basic commands required to start and stop the
webserver are as follows:
·
Start Apache: ./apache2
start.
·
Stop Apache: ./apache2
stop.
For more information on using Oinkmaster, please
reference, http://oinkmaster.sourceforge.net/.
The shell script located in /etc/cron.daily is the basic command to run
the Oinkmaster Perl script. The -o <directory> is a
required argument. The downloaded files are compared to any existing rules in
this directory before overwriting them.
Oinkmaster Perl script:
------------------------------------------------------------------------------------
#!/bin/bash
/usr/local/bin/oinkmaster.pl
-o /usr/local/snort/rules/
/usr/bin/killall -HUP snort
--------------------------------------------------------
For additional instructions on accessing the PostgreSQL
Interactive Terminal, please reference, http://www.postgresql.org/docs/8.1/static/tutorial-accessdb.html.
Included in this section are the names of users and the database created for
our lab experiment.
One database was created.
·
Name of database: snortdb
Two users were created.
·
Super user name: binh
·
User with write permission: snortadmin
Example of command to remotely log into database:
./psql
–h 10.0.0.10 –U snortadmin snortdb
In PostgreSQL Interactive Terminal, use the
–o switch to send queries to a file. When logged on from Router machine,
follow the instructions provided below
1) Open
terminal.
2) Change
directory by issuing command:
cd
/usr/local/postgres-8.1-1/bin.
3) Login into database issuing -o command:
./psql -h 10.0.0.10 -U
<username> <name of database> -o <name of file>
For example,
./psql -h 10.0.0.10 -U binh
snortdb -o '/root/data/query/test.txt'
4) Once logged
in, type in query and results will output to specified file.
This is an
example of a query to obtain various information for a given day.
SELECT
event.timestamp, signature.sig_sid, signature.sig_priority, signature.sig_name,
signature.sig_class_id, sig_class.sig_class_name, int8ip_to_str(iphdr.ip_src)
as ipSrc, int8ip_to_str(iphdr.ip_dst) as ipDest, iphdr.ip_ttl,
iphdr.ip_proto as ipProtocol, event.cid as eventID
FROM
(event INNER JOIN iphdr ON event.cid = iphdr.cid) INNER JOIN
(sig_class INNER JOIN signature ON
sig_class.sig_class_id = signature.sig_class_id) ON event.signature =
signature.sig_id
WHERE
(event.timestamp > '2006-03-09 23:59:24.912-08') AND (event.timestamp
< '2006-03-11 00:00:02.194-08') AND (event.sid = iphdr.sid)
ORDER
BY event.timestamp ;
Other parameters can be passed to the Snort script.
Users must change directory to /etc/rc.d and issue the following
commands to:
·
Start Snort: ./snort
start
·
Restart Snort: ./snort restart
·
Stop Snort: ./snort
stop
·
Reload Snort: ./snort
reload
The details of the Snort script reads:
------------------------------------------------------------------------------------
#!/bin/bash
case
"$1" in
start)
/usr/local/snort/bin/snort -D -i eth0 –c
/usr/local/snort/rules/snort.conf
;;
stop)
/usr/bin/killall snort
;;
restart)
/usr/bin/killall snort
/usr/local/snort/bin/snort -D -i eth0 –c
/usr/local/snort/rules/snort.conf
;;
reload)
/usr/bin/killall -HUP snort
;;
*)
echo "Usage: $0 {start|stop|restart|reload}"
exit 1
esac
------------------------------------------------------------------------------------
This section details scripts, files and directories
associated with PostgreSQL. For additional instructions on starting the
PostgreSQL database, please reference http://www.postgresql.org/docs/8.1/static/postmaster-start.html.

Table 9.
Essential Files of the Data-Capture Machine.
Other parameters can be passed to the PostgreSQL script.
Users must change directory to /etc/init.d and issue the following
commands to:
·
Start PostgreSQL server: ./postgres start
·
Restart PostgreSQL server: ./postgres restart
·
Stop PostgreSQL server: ./postgres stop
·
Reload PostgreSQL server: ./postgres reload
The details of the PostgreSQL server script reads:
------------------------------------------------------------------------------------
#!/bin/bash
case
"$1" in
start)
/bin/su
postgres -c "/usr/local/postgres/bin/pg_ctl -D /var/pgdata/ start"
;;
stop)
/bin/su
postgres -c "/usr/local/postgres/bin/pg_ctl -D /var/pgdata/ stop"
;;
restart)
/bin/su
postgres -c "/usr/local/postgres/bin/pg_ctl -D /var/pgdata/ restart"
;;
reload)
/bin/su
postgres -c "/usr/local/postgres/bin/pg_ctl -D /var/pgdata/ reload"
;;
*)
echo
"Usage: $0 {start|stop|restart|reload}"
exit 1
esac
------------------------------------------------------------------------------------
This section details how an ODBC connection was created
to access the Snort data on the NPS network server. We were granted read-only
access to three separate databases: SnortCurrent, Snort8-30, and
SnortStatistics. Once logged into the NPS domain, we setup the connection from
a Windows XP computer. The instructions are as follows:
1) Goto
Control Panel-> Adminstrative Tools -> Data Sources (ODBC)
2) From ODBC
Data Source Adminstrator screen: Add -> MS Access Database
3) From New
Data Source: SQL Server -> Finish
4) From Data
Source to SQL Server:
Enter name:
(e.g. SnortCurrent)
Enter
Server: 172.20.48.54 -> Next
5) Enable
'With SQL Server authentication using login ID and password entered by the
user'
Enter Login
ID: <username>
Enter
password: <password>
(NOTE: Request
access to database server and verify server ip address with NPS Network
Security Group)
6) Click on
Client Configuration button
7) From Edit
Network Library Configuration:
Select: TCP/IP
Server
name: 172.20.48.54
Port
number: 2433
8) Test
connection -> Okay
This details the occurrence of an alert by its
classification by day for each of the seven weeks in our study. Figure 13 is
the Legend associated with Figures 14 – Figure 20.

Figure 18. Honeypot Classification Legend
Figure 19.
Honeypot Classification: Jan. 29 – Feb.

Figure 20. Honeypot Classification: Feb. 05 – Feb. 11

Figure 21. Honeypot Classification: Feb. 12 – Feb. 18
Figure 22. Honeypot Classification: Feb. 19 – Feb. 25

Figure 23.
Honeypot Classification: Feb. 26 – Mar. 04

Figure 24. Honeypot Classification: Mar.05 – Mar. 11

Figure 25. Honeypot Classification: Mar.12 – Mar. 18
THIS
PAGE INTENTIONALLY LEFT BLANK
[1] Gordon, Lawerence A, Loeb,
Martin P., Lucyshyn, William, and Richardson, Robert, "2005 CSI/FBI Computer
Crime and Security Survey,"
http://www.cpppe.umd.edu/Bookstore/Documents/2005CSISurvey.pdf,
accessed March 2006.
[2] The Honeynet Project, Know
Your Enemy: Learning about Security Threats, Second Edition, Boston, MA: Addison-Wesley, 2004.
[3] "Blackhat," http://en.wikipedia.org/wiki/Blackhat,
accessed February 2006.
[4] Jordan, Christopher J., Zhang,
Qiang, Royes, Jason, "Determining the Strength of Decoy System: A Paradox of
Deception and Solicitation, Proc IEEE Workshop on Information Assurance,
New York, West Point, pp. 138-145, June 2004.
[5] Beale, Jay et al, Snort 2.1
Intrustion Detection, Second Edition, Rockland, MA: Syngress Publishing,
2004.
[6] "Lancope's StealthWatch," http://www.lancope.com/products/,
accessed February 2006.
[7] "Snort, the De Facto Standard
for Intrusion Detection/Prevention," http://www.sort.org,
accessed March 2006.
[8] The Honeynet Project, "Know Your
Enemy: Honeynets, What a honeynet is, its value, and risk/issues involved," http://www.honeynet.org/papers/honeynet/,
accessed February 2006.
[9] "The Honeynet Project," http://www.honeynet.org,
accessed February 2006.
[10] McCarty, Bill, "The Honeynet
Arms Race," IEEE Security and Privacy, 1(6), pp. 79-82,
November/December 2003.
[11] "VMware User's Manual," http://www.vmware.com/pdf/ws5_manual.pdf,
accessed November 2005.
[12] Microsoft Windows Server 2003,
"Internet Information Services," http://www.microsoft.com/WindowsServer2003/iis/default.mspx,
accessed November 2005.
[13] "Dissecting Snort," http://vig.pearsonptr.com:8081/samplechapter/157870281X.pdf,
accessed November 2005.
[14] Rowe, Neil C., Duong, B. T.,
and Custy, John, "Fake Honeypots: A Defensive Tactic for Cyberspace," draft,
Computer Science Department, Naval Postgraduate School, March 2006.
1.
Defense Technical Information Center
Ft. Belvoir, VA
2.
Dudley Knox Library, library@nps.edu
Naval Postgraduate School
Monterey, CA
3.
Dr. Neil Rowe, ncrowe@nps.edu
Naval Postgraduate School
Monterey, CA
4.
Mr. J.D. Fulp, jdfulp@nps.edu
Naval Postgraduate School
Monterey, CA
5.
Dr. Cynthia E. Irvine, irvine@nps.edu
Naval Postgraduate School
Monterey, CA
6.
Binh T. Duong, btduong@nps.edu
Naval Postgraduate School
Monterey, CA
7.
John Custy, custy@spawar.navy.mil
SPAWAR
San Diego, CA
