
NAVAL
POSTGRADUATE
SCHOOL
MONTEREY, CALIFORNIA
THESIS
 |
Approved for public release. Distribution is unlimited.
THIS PAGE INTENTIONALLY LEFT BLANK
NAVAL
POSTGRADUATE
SCHOOL
MONTEREY, CALIFORNIA
THESIS
|
Approved for public release. Distribution is unlimited.
THIS PAGE INTENTIONALLY LEFT BLANK
REPORT DOCUMENTATION PAGE |
Form Approved OMB |
|||||
|
Public reporting burden for this collection of information is estimated to average 1 hour per response, including the time for reviewing instruction, searching existing data sources, gathering and maintaining the data needed, and completing and reviewing the collection of information. Send comments regarding this burden estimate or any other aspect of this collection of information, including suggestions for reducing this burden, to Washington headquarters Services, Directorate for Information Operations and Reports, 1215 Jefferson Davis Highway, Suite 1204, Arlington, VA 22202-4302, and to the Office of Management and Budget, Paperwork Reduction Project (0704-0188) Washington DC 20503. |
||||||
|
1. AGENCY USE ONLY (Leave blank) |
2. REPORT DATE June 2017 |
3. REPORT TYPE AND DATES COVERED Master’s thesis |
||||
|
4. TITLE AND SUBTITLE LOG ANALYSIS USING SPLUNK HADOOP CONNECT |
5. FUNDING NUMBERS
|
|||||
|
6. AUTHOR(S) Boulat Chainourov |
||||||
|
7. PERFORMING ORGANIZATION NAME(S) AND ADDRESS(ES) Naval Postgraduate School Monterey, CA 93943-5000 |
8. PERFORMING ORGANIZATION REPORT NUMBER |
|||||
|
9. SPONSORING /MONITORING AGENCY NAME(S) AND ADDRESS(ES) N/A |
10. SPONSORING / MONITORING AGENCY REPORT NUMBER |
|||||
|
11. SUPPLEMENTARY NOTES The views expressed in this thesis are those of the author and do not reflect the official policy or position of the Department of Defense or the U.S. Government. IRB number ____N/A____. |
||||||
|
12a. DISTRIBUTION / AVAILABILITY STATEMENT Approved for public release. Distribution is unlimited. |
12b. DISTRIBUTION CODE
|
|||||
|
13. ABSTRACT (maximum 200 words)
The purpose of this research it to use Splunk and Hadoop to do timestamp analysis on computer logs. Splunk is a commercial data analytics tool. Hadoop is a system for large-scale distributed storage and processing. This research ingested computer logs from two kinds of forensic data from the Real Data Corpus to establish a baseline and find anomalies. We analyzed timestamps and EventIDs on over two thousand logs across hundreds of drives. Additionally, we used a large packet captures from CAIDA to test Hadoop's ability to store and transfer data between HDFS and Splunk. We used Splunk Hadoop Connect for data transfer between a Splunk server and a Hadoop cluster. Splunk was able to effectively identify and represent statistical anomalies in log files. These anomalies could reveal misconfiguration, security concerns, or unusual but harmless traffic. Splunk could also easily transfer data to relatively inexpensive commodity servers using Splunk Hadoop Connect.
|
||||||
|
14. SUBJECT TERMS Splunk, Hadoop, log analysis, timestamp analysis, event viewer, computer security, big data, analytics, forensics, cyber forensics |
15. NUMBER OF PAGES 65 |
|||||
|
16. PRICE CODE |
||||||
|
17. SECURITY CLASSIFICATION OF REPORT Unclassified |
18. SECURITY CLASSIFICATION OF THIS PAGE Unclassified |
19. SECURITY CLASSIFICATION OF ABSTRACT Unclassified |
20. LIMITATION OF ABSTRACT
UU |
|||
NSN 7540-01-280-5500 Standard Form 298 (Rev. 2-89)
Prescribed by ANSI Std. 239-18
THIS PAGE INTENTIONALLY LEFT BLANK
Approved for public release. Distribution is unlimited.
LOG ANALYSIS USING SPLUNK HADOOP CONNECT
Boulat Chainourov
Captain, United States Marine Corps
B.S., Norwich University, 2010
Submitted in partial fulfillment of the
requirements for the degree of
MASTER OF SCIENCE IN COMPUTER SCIENCE
from the
NAVAL POSTGRADUATE SCHOOL
June 2017
Approved by: Neil C. Rowe
Thesis Advisor
Arijit Das
Co-Advisor
Peter Denning
Chair, Department of Computer Science
THIS PAGE INTENTIONALLY LEFT BLANK
The purpose of this research it to use Splunk and Hadoop to do timestamp analysis on computer logs. Splunk is a commercial data analytics tool. Hadoop is a system for large-scale distributed storage and processing. This research ingested computer logs from two kinds of forensic data from the Real Data Corpus to establish a baseline and find anomalies. We analyzed timestamps and EventIDs on over two thousand logs across hundreds of drives. Additionally, we used a large packet captures from CAIDA to test Hadoop's ability to store and transfer data between HDFS and Splunk. We used Splunk Hadoop Connect for data transfer between a Splunk server and a Hadoop cluster.
Splunk was able to effectively identify and represent statistical anomalies in log files. These anomalies could reveal misconfiguration, security concerns, or unusual but harmless traffic. Splunk could also easily transfer data to relatively inexpensive commodity servers using Splunk Hadoop Connect.
.
THIS PAGE INTENTIONALLY LEFT BLANK
TABLE OF CONTENTS
I. INTRODUCTION.................................................................................................. 1
A. MOTIVATION............................................................................................ 1
B. DIFFICULTIES IN LOG ANALYSIS..................................................... 2
C. VALUE FOR THE DEPARTMENT OF DEFENSE............................. 3
D. RESEARCH QUESTIONS...................................................................... 4
E. THESIS ORGANIZATION...................................................................... 4
II. BACKGROUND.................................................................................................... 7
A. GENERAL APPLICATIONS OF LOG ANALYSIS............................. 7
B. LOG ANALYSIS FOR DEBUGGING.................................................... 8
C. REGISTRY INVESTIGATION.............................................................. 10
D. Discovering Interesting Events with Splunk............. 11
III. LOG ANALYSIS TECHNIQUES..................................................................... 13
A. COMMON LOGS GENERATED BY OPERATING SYSTEMS..... 13
1. Microsoft Windows Logs....................................................... 13
2. OS X............................................................................................. 15
3. UNIX............................................................................................. 15
B. LOG ANALYSIS TOOLS...................................................................... 16
1. Wireshark................................................................................... 16
2. Splunk......................................................................................... 17
IV. METHODOLOGY............................................................................................... 23
A. INPUT SELECTION............................................................................... 23
1. Forensic Corpus Log Files.................................................... 24
2. Anonymized Internet Trace Dataset.................................... 27
B. HADOOP SYSTEM............................................................................... 29
V. RESULTS............................................................................................................ 31
A. EVENT VIEWER LOG ANALYSIS..................................................... 31
B. WINDOWS WMI SERVICE and WINDOWS UPDATE AGENT LOG ANALYSIS................................................................................................ 40
C. HADOOP DATA TRANSFER AND STORAGE TESTING............. 45
D. PROCESSING TIME RESULTS......................................................... 47
VI. CONCLUSION.................................................................................................... 52
A. ACHIEVEMENTS................................................................................... 52
B. WEAKNESSES...................................................................................... 52
C. FUTURE WORK..................................................................................... 53
APPENDIX A. TESTBED SETUP............................................................................... 55
A. TESTBED SPECIFICATIONS............................................................. 55
B. HADOOP SETUP................................................................................... 56
C. SPLUNK SETUP.................................................................................... 57
D. SPLUNK HADOOP CONNECT SETUP............................................ 57
APPENDIX B. SPLIT AND CONVERT SHELL SCRIPTS..................................... 59
E. SPLIT SCRIPT....................................................................................... 59
F. CONVERT SCRIPT............................................................................... 60
List of References............................................................................................... 62
initial distribution list..................................................................................... 66
LIST OF FIGURES
Figure 1. Microsoft Windows Channel Groups................................................... 14
Figure 2. Microsoft Windows Channel Types..................................................... 14
Figure 3. Count of Events Over Time.................................................................. 19
Figure 4. Top 10 Event Identification Numbers.................................................. 20
Figure 5. Splunk map of internet connections (zoomed out)........................... 21
Figure 6. Splunk map of internet connections (zoomed on China)................. 21
Figure 7. Conversion resource consumption...................................................... 28
Figure 8. Distribution of Events in Years............................................................. 33
Figure 9. Distribution of Events During Months of the Year............................. 34
Figure 10. Distribution of Events During Hours of the Day................................. 35
Figure 11. Distribution of Events During Days of the Week............................... 36
Figure 12. Distribution of Events During Minutes of the Hour............................ 37
Figure 13. Events Time Graph................................................................................ 38
Figure 14. Timechart of Top 10 sources (2004-2013)......................................... 39
Figure 15. Timechart of Top 10 sources (2004-2006)......................................... 40
Figure 16. Data distribution per Country................................................................ 42
Figure 17. .log Event Distribution over Time......................................................... 43
Figure 18. Distribution of Log Events and Microsoft Updates............................ 44
Figure 19. Distribution of Log Events and Sources............................................. 45
Figure 20. Data transfer time from Splunk server to Hadoop cluster............... 46
Figure 21. PCAP split time....................................................................................... 48
Figure 22. Binary to CSV conversion time............................................................ 48
Figure 23. Testbed Connection Diagram.............................................................. 55
Figure 24. HDFS Permissions................................................................................. 58
LIST OF TABLES
Table 1. Amount of .evt Data per Location........................................................ 31
Table 2. Log file distribution................................................................................. 41
Table 3. Amount of .log Data per Location........................................................ 41
Table 4. Testbed Hardware Specifications........................................................ 56
THIS PAGE INTENTIONALLY LEFT BLANK
LIST OF ACRONYMS AND ABBREVIATIONS
ASCII American Standard Coded Information Interchange
ASL Apple System Log
CAIDA Center for Applied Internet Data Analysis
DOD Department of Defense
CSV Comma Separated Value
ELK Elasticsearch Logstash Kibana
GMT Greenwich Mean Time
GUI Graphical User Interface
HDFS Hadoop Distributed File System
ICMP Internet Control Message Protocol
IDS Intrusion Detection System
IIS Internet Information Services
IT Information Technology
NIC Network Interface Card
NPS Naval Postgraduate School
NIST National Institute of Standards and Technology
NTP Network Time Protocol
OS Operating System
OSI Open Systems Interconnection
PCAP Packet Capture
RSA Rivest, Shamir, Adleman
SIEM Security Information and Event Management
SPL Splunk Processing Language
TCP Transmission Control Protocol
UDP User Datagram Protocol
YARU Yet Another Record Utility
THIS PAGE INTENTIONALLY LEFT BLANK
ACKNOWLEDGMENTS
I would like to express my gratitude to Professor Neil Rowe and Professor Arijit Das who guided and mentored me throughout this process. I would like to thank Jim Zhou for providing invaluable support with the Hadoop cluster and Marc Wilson for giving me a Splunk evaluation license. In addition, a big thanks goes to the Lunch Club—Alexis, Dan, Josh, Justin, Raven, Taylor, Tony, and Victor—for their friendship. I also would like to express my thanks to CAIDA's supporters, the National Science Foundation, the U.S. Department of Homeland Security, and CAIDA Members.
I am especially thankful to my wife, Michelle, for her love, patience, and support. Thank you for being my life partner and my best friend.
THIS PAGE INTENTIONALLY LEFT BLANK
Making sense of the growing volume of machine data is a complicated problem. Machine data, in our case computer logs, is information automatically generated by computers without any human involvement. In this thesis, we will investigate a way to analyze computer logs in large volumes to increase computer security in an effective way. We will use Hadoop big data “ecosystem,” Splunk analytics software, and a few freely available log management programs.
According to National Institute of Standards and Technology (NIST) Guide to Computer Security Log Management, "a log is a record of the events occurring within an organization's systems and networks" (NIST, 2006, pp. 2-1). Examples are operating-system event logs, network traffic logs, and application logs. In this chapter, we discuss the motivation for this thesis and the positive benefits that log analysis may yield. We then present the research questions and thesis organization.
Information technology professionals agree that performance and networking logs are important (Allen, 2001). Analyzing logs can help system administrators make their servers and clients more secure. Logs can help sales managers understand their customer’s shopping and browsing habits. Law enforcement agencies can use logs for forensic purposes. Machine data can help network administrators understand traffic patterns on the network and identify bottlenecks or resource exhaustion. Computer logs are required for compliance in the government-regulated industries. Records concerning medical, financial, and safety data require log generation and retention (FTC, 2006). New laws concerning computer logs increase the demand for management and analysis of logs even in industries that have little to do with computers (Federal Motor Carrier Safety Administration, 2015). Ultimately, quality log analysis can have a positive effect on most aspects of computing and communication.
Most challenges in log analysis are in inconsistency, volume, and distribution. Log data structures vary with every source that generates this information. Networking logs have a different structure and contain different information than operating-systems logs. Windows Operating System (OS) event logs are different from UNIX OS event logs. The former use a binary format, while the latter use American Standard Coded Information Interchange (ASCM) text format. Logs usually contain timestamps, the times recorded by the machine when events occur, attached to the event-log entry. Timestamps are especially useful because they allow analysts to correlate events across the network or enterprise based on time.
Timestamps present challenges. Machines have internal clocks that are often not precise or have a time drift. This causes clocks across a network or a managed system to vary, sometimes significantly. The Network Time Protocol (NTP) reduces the problem but adds additional complexity to the management of computers and networks. Another problem with timestamps is the lack of a standard format. Format can vary based on the operating system, the software vendor, and user preferences. Time may be displayed in 24-hour or 12-hour format, it can be local time or Greenwich Mean Time (GMT), or it can be the number of seconds since 1 January 1970 (also known as POSIX time or Epoch Time). It is important for an organization is to ensure all devices in the enterprise use the same time format across devices or have a way to normalize different formats to one standard.
Another difficulty in log analysis is the volume of data. Machine data volume grows significantly with the number of devices that produce logs. Finding a solution for a specific issue requires the ability to find only relevant information. This usually involves filtering out a large portion of routine data. Reducing unnecessary data also helps the analyst identify anomalies and errors. Machine data from multiple devices is often stored on a single log server. A network administrator often must filter out irrelevant logs. These logs may be from devices or applications that are not part of the process the administrator is trying to analyze.
Computers cannot record everything that happens on a system since this could create more log data than user data. However, they do need to record a considerable amount of information since complicated security problems often require statistical analysis of the available logs followed by deeper investigation, and both steps require significant amounts of data to support reliable conclusions. A centralized storage and processing scheme for logs enables correlating events across a network and understanding the complex problems that security professionals and administrators face.
The U.S. Department of Defense is managing one of the largest computing enterprises in the world. In 2011, the DOD consisted of "15,000 classified and unclassified networks, more than 7 million computers and IT devices, and a 170,000-person IT workforce" (U.S. Department of Defense, 2011). A better, more effective and efficient way to manage logs would reduce the Information Technology (IT) overhead and increase the security of the enterprise.
Threats to DOD cyberspace are more serious and more sophisticated than threats to civilian sites, and thus need detailed log analysis. Advanced persistent threats and state-sponsored actors are constantly searching for vulnerabilities in the DOD information systems. Cyber defense measures are not always adequate to keep attackers out. Log analysis can help identify, isolate, and eradicate the nefarious activities as well as provide areas of improvement for cyber defenders.
Log analysis is often treated as a low-priority menial task, or as a reactive measure, an indicator of compromise. However, an automated daily log analysis is important to managing a safe and efficient computer network. Log analysis is usually central in analyzing a security incident, but it is also a way to prevent potential incidents before they happen.
This research aims to address how to use a big-data platform to efficiently and effectively manage a large amount of log data. Specifically, the research questions are:
· How effective is Splunk Processing Language (SPL) in finding statistical anomalies in the log data?
· How efficient is Hadoop Distributed File System (HDFS) in storing a large amount of data and processing it efficiently?
· How can Splunk and Hadoop be integrated to enable log management on a large scale?
Chapter II reviews relevant work by notable authors. The discussion focuses on general application of log analysis for security, performance improvement, and debugging. The chapter concludes with a description of a specific implementation of log analysis for debugging purposes.
Chapter III is about log analysis techniques. It begins by describing the problems that impede the log analysis process. Then follows a review of standard logs in common operating systems. This section presents the location and purpose of default logs available in Windows, OS X, and UNIX operating systems. Then we discuss the log collection and analysis tools of Snort, Wireshark, and Splunk.
Chapter IV details the methodology of the research project and discusses how suspicious log entries may alert an analyst that nefarious activity is taking place. It then presents several common intrusion signatures that are likely to show that an incident is unfolding or has happened.
Chapters V and VI discuss results, conclusions, and the potential for future work.
THIS PAGE INTENTIONALLY LEFT BLANK
This chapter provides a brief review of relevant work by other researchers. We will explore the major findings, the applicability of those works to this thesis, as well as the differences between the aim of those works and this thesis.
Research was conducted to address the ability of log analysis to answer general questions concerning debugging, performance improvement, and security of systems (Oliner, Ganapathi, and Xu, 2011). It described log-centric management of systems using existing technologies as well as the challenges that inhibit the ability of a system administrator to analyze logs effectively and efficiently.
Log analysis is a useful tool when debugging programs or systems. Using a smart logging construct, a programmer can replay the logical sequence of program execution and ensure the system is behaving in accordance with its design. Incorporating logs from multiple sources is essential in monitoring complex software written by multiple developers. It is also essential in monitoring extensive systems of interdependent components. A possible problem is a varying degree of importance accorded to different log entries by different developers. Additionally, an overcomplicated logging scheme may create more confusion than it solves. It can also generate a log volume that is prohibitively large.
Splunk and Solarwinds have established performance improvement in log analysis as a major lever for a successful business. Smart logging may reveal bottlenecks and performance losses caused by individual components and by interactions between them. One performance difficulty with log analysis is the observer effect. The act of running a logging service puts a performance tax on the system and may cause the degradation of performance. More thorough logging will cause a greater effect on the system, although less thorough logging may cause the analyst to miss important information.
Security of a system benefits from log analysis. Routers, network security devices, and individual computers keep logs useful in cyber defense and reconstruction of a security breach. These logs can reveal intrusion attempts, malicious code execution, and improper use. However, it may be difficult to recognize and reconstruct some suspicious events because it is often difficult to distinguish between a log entry resulting from a normal operation of a system and the entry resulting from harmful behavior.
Historical log data can help analysts predict the future behavior of a system. Data points related to computing resources, workload, and capacity can create a model of past utilization that is useful in addressing future needs. As computing systems undergo changes and upgrades, data points will change and sometimes lose their value.
Research describing a large-scale log analysis was conducted on five supercomputers (Oliner & Stearley , 2007). It addressed the scope and the challenges of log analysis with the goal of identifying the root cause of errors as well as predicting failure of a normal computer operation. These failures vary from a major system-wide breakdown to a loss of connection with a single node that impacts performance. The research used specialized supercomputer system logs to combat and predict failures. The team recorded over 178 million log entries totaling over 111 gigabytes of data. They worked with the system administrator of each machine to identify which log messages were alerts and sort them into appropriate categories based on type and severity.
Log messages were difficult to classify because they lacked external context. Without knowing the context at the time of a failure message, it was impossible to determine if the alert resulted from a system administrator's action or was an error during normal operation. This analysis required additional information such as the system state (production or maintenance), whether the system underwent an upgrade, and whether the system was scheduled for downtime. Research found silent failures that left no record in the logs as well as messages that did not provide useful information. They also encountered failure types that produced different alert signatures. Some nodes did not produce any logs due to misconfiguration or incorrect attribution. Although designed for high reliability, some log messages were corrupt, incomplete, or had an incorrect timestamp.
The volume of administrative messages and failures that resulted in multiple alerts necessitated extensive filtering. The researchers noted that a single error could trigger multiple alerts on several nodes. For example, a disk failure would affect all the tasks running on a particular node and generate an alert message not only for the disk failure but also for each job that had to be cancelled. The researchers' goal was to reduce alert to failure ratio to one. This means that one failure would generate only one alert. Two types of filters were implemented, temporal and spatial. The temporal filter discarded messages from the same source if they arrived within five seconds. The spatial filter would block the alert if another node had already reported the error. These filters reduced the cost of computing and simplified analysis. However, this filter could erroneously remove the same alert from independent nodes that happened within five seconds of each other.
In this work, time-based modeling of alerts, while appropriate for low-level errors resulting from hardware, was not as useful in predicting high-level operations like job scheduling, quality of service, and checkpoints. The high-level alerts had a higher degree of interdependence where errors in one node resulted in cascading failures across the system. Correlation of alerts from different sources that share a root cause is difficult without understanding of the component’s interdependence.
The Windows Registry is a rich source of log files on Windows systems. Some research concerned changed registry values resulting from an attack on a Windows operating system (Saidi, Ahmad, Noor, & Yunos, 2013). The research involved recording a baseline of the registry values on a clean system then installing keyloggers and Virtual Network Computing (VNC) protocol. The keyloggers allows a user to record the keystrokes made by the user and VNC allows a user to remotely control the target machine. After the computer was compromised with these utilities, another registry record was made. The two records were compared with Yet Another Record Utility (YARU) for inconsistencies (TZWorks, 2017).
The process of installing the Virtual Network Computing protocol created several registry keys. These keys contained administrative values such as setup preference, application version, installation date, and license number. The keys also contained sensitive information like the record of recent user activity, the RSA private key for the current session, and the commands that were executed from the "Run" command. The keylogger installation did not create any registry keys for the program itself. However, an entry was created as the byproduct of software installation under the "HKEY_CURRENT_USER\Software\Microsoft\Windows\CurrentVersion\Explorer\UserAssist" key pointing to the keylogger's executable file. In conclusion, these methods could identify activity resulting from an installation of VNC and keyloggers on a system. Additionally, the research underscored the importance of registry monitoring and analysis of anomalies in key values.
Another investigation examined registry changes from BitTorrent software (Venčkauskas, et al., 2015). The research involved comparing registry keys before and after the installation of its client application. This service can be used for nefarious purposes link sharing malware or data exfiltration. The research took registry key and value snapshots for three steps: installing the BitTorrent client, downloading a file using BitTorrent client, and uninstalling the client. This method found some BitTorrent activity artifacts that remained in the registry even after uninstalling the software. They could compare the changes to the baseline and establish that BitTorrent client was installed on the system. This provides additional arguments for the utility of registry investigation, establishing a baseline, and analyzing machine data for security purposes.
Another investigation used Splunk to discover unusual events (Roberts, 2013). This included searching, analyzing, and reporting capabilities as well as analytic capabilities from additional applications t. Example searches are given to detect cross-site scripting attacks, SQL-injection attacks, and searching for open ports that increase vulnerability of a system.
Other work researched detecting malicious activity on a Windows network (Speece, 2016). The author focused on creating custom dashboards and alerts for suspicious activity. Dashboards are a collection of graphs and panels that visually represent specific information; alerts are notifications to the system administrator triggered by a specific condition that run either in real-time or on a schedule. Using these, the work found penetration testing attempts on a Windows network. Suspicious activity included user-account lockouts, multiple failed logons, and shell bypasses. Additionally custom searches helped system administrators harden the system against exploitation. Splunk also alerted administrators about inactive accounts or suspicious accounts.
THIS PAGE INTENTIONALLY LEFT BLANK
Log-analysis tools range from open-source freely-available tools to proprietary software. We then discuss common logs generated by various operating systems and built-in tools to use them.
Each operating system generates logs of different types and formats. Recent versions of Microsoft Windows and OS X use binary formats; UNIX and Linux operating systems use a text-based format.
In Microsoft Windows prior to Vista and Server 2008, a system called Event Logging was managing computer logs. The files had an .evt extension and were in a proprietary binary format. This means Event Viewer applications was required to open and interpret the log files. In versions of Microsoft Windows developed after 2008, a system called Windows Event Log service stored and managed events. This system used a new format called EVTX to store log files. It expanded the priorities list, allowed for an Extensible Markup Language (XML) format of messages, and offered an updated Event Viewer log analyzer. The main improvement is the ability to forward events to remote computers, as well as to collect events from other Windows machines. Windows log settings are configured from the Event Viewer interface.
Event Viewer is a complex way to view and analyze logs. Event Viewer breaks up Windows logs into groups and channels (Microsoft, 2009). Two main groups are Windows Logs and Application and Services Logs (see Figure 1). Windows Logs contains traditional Application, Security, and System channels. It also contains two new channels, Setup and Forwarded Events. Application and Services Logs contain channels from individual applications or services.

Figure 1. Microsoft Windows Channel Groups
Event Viewer further breaks up the events into channel types and event types (see Figure 2). The two channel types are Serviced and Direct. The Serviced type further breaks down into Administrative and Operational group types. The direct channel type contains Analytic and Debug group types. The distinction between the channel types is important because Serviced channels can be forwarded, collected, and analyzed remotely where Direct channel types cannot.

Figure 2. Microsoft Windows Channel Types
Windows stores log files in the <systemroot>\System32\winevt\Logs example C:\Windows\System32\winevt\Logs. The most interesting files from the security perspective are Application, Security, and System logs.
Apple OSX OS versions since OSX 10.4 use syslogd and Apple System Log (ASL) as a log management facility (Apple Inc, 2004). ASL stores information in a binary format, unlike previous versions, which stored logs in a plain text format. Logs stored in binary format require the Apple Console utility or its equivalent to view the logs. Mac OS X logs are located in few key places:
· /Var/log contains system logs.
· /Library/Logs contain some system logs as well as user logs.
· /Library/Application Support/ may contain some application specific logs.
The most interesting directories and files from the security perspective are the ASL logs (/private/var/log/asl/), audit logs (/private/var/audit/), and system.log (/var/log/system.log).
UNIX and Linux logs are similar to each other. The log format is fairly standard. Each message has the structure MMM DD HH:MM:SS Host Service: Message.
UNIX and Linux keep most of the system logs in the /var/log folder. Application-specific logs are usually kept in the /var/log/<application> folder, but they may also reside in the application-specific installation folder. Rsyslog is the system that manages system logs in UNIX and Linux. It is an extended version of syslog that was adopted in the early 2000s. Syslogd is the daemon that manages system logs. The most interesting log files are auth.log, kem.log, and syslog. Auth.log tracks the usage of authorization system. It records user logins as well as uses of "sudo" command, which elevates user privileges. Auth.log keeps track of remote logins, the secure-shell daemon, and the Pluggable Authentication Module system. Kern.log stores messages from Linux kernel and may be useful when kernel modification is suspected. Syslog is generally the most informative log file in Linux. It contains information that is general to the system or information that does not belong in any other log. Syslog replaces 'messages' log in older operating systems.
In this research, we primarily used Splunk as the log analysis tool. We also used Wireshark and command-line version of Wireshark called TShark. The primary appeal of Wireshark and TShark is that they are free, compatible with popular operating systems, frequently updated, and have a large community of contributors. Popular commercial network analysis programs are Solarwinds (Solarwinds, 2016), Splunk (Splunk, 2017) and Sawmill (Sawmill, 2016). This thesis primarily discusses Wireshark and Splunk:
Wireshark is a free and open-source network-packet analyzer. It allows capturing live network traffic and analyzing it offline. In addition, Wireshark can import and analyze various formats of packet captures (pcaps). The program can also export data into various formats such as Comma Separated Value (CSV) or plain text; this is the primary benefit of the software for this thesis. Additionally, Wireshark is compatible with all major operating systems including Windows, OS X, Linux, and UNIX-based operating systems.
Wireshark comes with a useful suite of traffic-analysis tools including endpoint analysis, conversation trackers, Dynamic Host Configuration Protocol (DHCP) analysis, and packet-length statistics. Wireshark can filter traffic it ingests, as well as aid in the analysis of the captured information. It allows the analyst to search for a particular string or a value in the packet's contents and its description.
Wireshark's sponsor Riverbed (Riverbed, 2017) claims that "Wireshark is the world's foremost network protocol analyzer. It lets you see what is happening on your network at a microscopic level. It is the de facto (and often de jure) standard across many industries and educational institutions" (Wireshark, 2107). However, the basic version of the Wireshark analyzer does not scale well to large-size installations because it limits the size of the file you can open. Files over 200 megabytes slow down the application's analytical and statistical capabilities, and usually fail to open.
Wireshark is often unable to capture every packet that reaches a computer's Network Interface Card (NIC). This limitation arises from the relative speed of the computer's NIC and the computer's hard drive. If the computer has a very fast NIC (1Gbps) and a relatively slow hard drive, Wireshark may have to drop more packets than it captures.
Splunk is a commercial log-analysis suite that uses a proprietary Splunk Processing Language (SPL) to analyze imported or collected machine data. SPL allows the user to create custom queries based on the data format to find relevant results, correlate them to other data, and present the information in a variety of charts, graphs, and geographic maps. SPL also enables a user to conduct a statistical analysis of the data.
Splunk can collect data from the local computer as well as from remote network sources that have the Splunk client installed. Importing and analyzing data in Splunk is called indexing. Splunk can index many types of machine data. Splunk works the best for CSV files, operating systems syslogs, and Apache web-server error logs. Splunk is used by several companies including Cardinal Health, Comcast, and Sony (Splunk, 2016) (IT Management, 2017).
SPL can only process text-based data. It cannot natively read binary files. Applications like Wireshark and Microsoft Event Viewer save logs in binary format. When Wireshark is operating in a packet capture mode, it creates a log of data packets that pass through the listening interface. This log is not human-readable and requires Wireshark or TShark programs to interpret the data. The solution for Wireshark is to export the log file as a CSV (comma-separated) file. Most other programs offer various export formats besides binary.
Another limitation is the licensing scheme. A user with a perpetual free license is limited to indexing 500 MB of data per day from all sources. In our experiments, a computer moderately used for eight hours generated on average 200 MB of networking logs. However, a single heavily utilized machine that collects logs from the operating system, third-party applications, and network traffic can easily generate over 800 MB of data per day.
A major appeal of Splunk is the ability to visually present information using various graphs and charts. Time charts are especially valuable because they can easily display behavior patterns that are present in the system or on the network. Splunk user can chose to represent data as averages over time, maximum and minimum values over time, top values, rare values, and top values by time. Figure 3 shows the histogram of events over time for the computer log data used in this research. Figure 4 shows the top ten EventIDs in the computer log data used in this research.
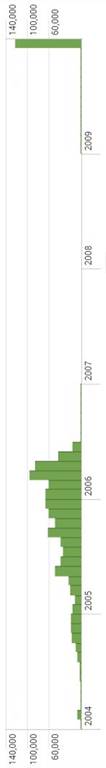
Figure 3. Count of Events Over Time.
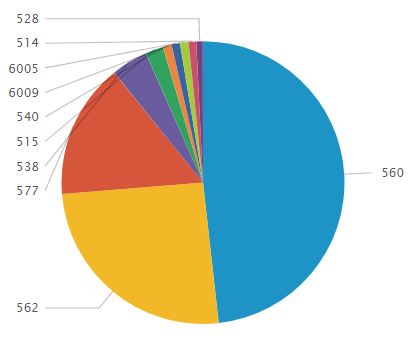
Figure 4. Top 10 Event Identification Numbers.
Splunk can present data as a geographic map. This can help identify the origin of the conversation as well as identify trends with moving nodes. Not all data has location information, and some data has coarse, misconfigured, or deceptive location information. Figure 5 shows network connections and traffic to a honeypot device at NPS from IP addresses throughout the world; China generates a disproportionately large amount of traffic. Figure 6 shows a more detailed view of connection points from China. Not all of these data points can be trusted, as some IP addresses may be spoofed.

Figure 5. Splunk map of internet connections (zoomed out)
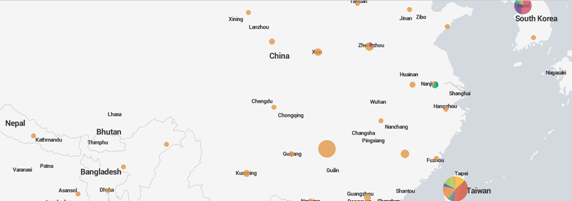
Figure 6. Splunk map of internet connections (zoomed on China)
The Splunk Hadoop Connect application is a program to transfer data between a Splunk server and a Hadoop cluster. The application requires Hadoop Command Line Interface (CLI) the Oracle Java Development Kit v1.6 or higher, and Kerberos client utilities to connect to Hadoop clusters that use Kerberos authentication. Hadoop CLI can run on certain versions of Apache Hadoop, Cloudera Distribution, and Hortonworks Data Platform. Splunk Hadoop Connect cannot run on Windows operating systems, only for versions of UNIX and Linux that can support a Splunk server.
THIS PAGE INTENTIONALLY LEFT BLANK
To test the effectiveness of SPL in finding statistical anomalies in log data, event logs must be imported into the Splunk server. After the Splunk indexer ingests the logs, a baseline is established. The baseline consists of dates and times when the logs were created. Logs are analyzed based on anomalies in time or data as compared to the baseline.
We tested the efficiency of the Hadoop Distributed File System (HDFS) in storing a large amount of data. Network traffic capture logs that were recorded by the Center for Applied Internet Data Analysis (CAIDA) were imported into the Splunk server and stored on the Hadoop cluster. We tested was how well Splunk and Hadoop could be integrated to enable log management on a large scale. For this purpose, we studied the Splunk Hadoop Connect application. We used Splunk Hadoop Connect for two-way data transport between the Splunk indexing server and a Hadoop cluster.
We used two sources of input data in our experiments. The first was the forensic corpus created and maintained at the Deep Laboratory of the Naval Postgraduate School. This source tested the ability of Splunk to ingest, index, and present Event Viewer and syslog data. This data is used to analyze events from individual devices, establish a baseline, and find deviations. This data source was relatively small at 424 megabytes. The second was anonymized Internet trace data provided by the Center for Applied Internet Data Analysis (CAIDA). This source tested the ability of Splunk to ingest large volumes of data for effective and efficient indexing, searching, and presenting the information for analysis.
The NPS forensic Real Data Corpus is a collection of drive images purchased from over 20 countries. As of 2015, the corpus contained 4018 images that held over 262.7 million files with 25.8 million unique hash values (Rowe, 2016). Some images were captured from mobile devices and external storage. The majority of the images came from desktop or laptop computers with Windows or *nix operating systems. Images from these devices were chosen to provide data for the thesis.
The devices varied from home-use personal computers to business-oriented servers. These computers were used to play video games, surf the web, store business data, act as mail servers, and serve other roles. The age of the devices was generally between 0 and 20 years old. Most of these images represented average computer use by a common person or business.
Currently, the Real Data Corpus contains 910,767 files
that have typical log file extensions. There are 95 types of log extensions
recorded in the Real Data Corpus. 801,893 files have ".log" extension,
which is a generic extension for most UNIX and Linux operating systems event
logging services. Some Windows logs and registry files also use
".log" extension. 13,444 files have ".err" extension, which
is an extension for error log files for some applications. 20,015 files have
".diagpkg" and ".wer" extensions, which created by
Microsoft Support Diagnostic Tool and Windows Error Reporting service. 12,955
files had
.evtx" or ".evt" extension, which are used by Windows Event
Viewer. The rest of the files belong to operating system and
application-specific log files, journals, and error-reporting services.
In our analysis, we focused on two types of Microsoft Windows logs, .evt logs created by the Event Viewer and .log files created by Windows WMI Service (Microsoft, 2011) or Windows Update. We did not differentiate between logs from different versions of Windows, but treated them as generic Event Viewer logs. Windows was chosen because it is more prevalent in the Real Data Corpus. Additionally, Windows operating system is more often used as a general-purpose operating system. It is used for business needs as well as for personal needs such as playing video games or browsing the web.
Of the 12,955 Event Viewer files, 340 were discarded because their size was less than 65 kilobytes. From the remainder of the files, we downloaded 141 .evt files. Out of these files, 80 files were corrupt and unreadable. We were able to analyze the remaining 61 Event Viewer files totaling 818 megabytes. Two files were from one host the United Arab Emirates, two files were from one host in Hong Kong, four files were from two hosts in Israel, 46 files were from 27 hosts in Mexico, four files were from two hosts in Palestine, and three files were from one host in Singapore.
These Event Viewer files contained 1,058,635 events spanning from January 1999 to December 2017. Most events took place from 2004 to 2006 and in 2009. The events that were recorded before 2004 and after 2009 were discarded to reduce their effect on the more representative data because they were not considered statistically significant. A total of 5,015 events or 0.5% were discarded.
The Real Data Corpus also contained 250,083 files that had the ".log" extension, were over 1024 bytes in size, were not a registry key, and were not deleted. From that number, we extracted 3.320 files of which 415 were empty. We imported the remaining 2,905 Windows WMI Service or Windows Update Agent message log files into Splunk.
These 2,905 .log files contained 2,473,489 events that spanned from January 1987 to July 2037. Splunk recorded 12,910 events as happening in the future because of the confusing timestamp formats. Splunk could not recognize the timestamp format automatically and made the best guess based on the first few characters at the beginning of the line in the log files. The majority of the events, 2,188,797, took place between November 2004 and September 2013. We chose these events for our analysis.
In this research, we assumed that the time data was accurate and representative of user behavior. A common problem with timestamps occurs in computers that are not synchronized with a time server. These computers often have incorrect system time when the internal computer clock drifts from the reference clock on the time server. Time metadata can be changed with specialized programs and is common enough to have its own name – Timestomp. Additionally, metadata can get corrupted in transfer, during storage, due to system malfunction, or maliciously. In this research, the file extension was taken at face value and the time data was verified with a simple filter. Times that are obviously incorrect, such as older than 20 years or in the future are discarded.
Splunk could ingest syslog events from Linux and UNIX computers without any modifications because they were in ASCII encoding. Event Viewer logs had to be first imported into an Event Viewer, and then converted from the binary format to a Comma Separated Value format for import into Splunk. When exporting Windows log entries to a CSV file, the Event Viewer has certain quirks. If the .evt file is imported into the Event Viewer and is not changed to the new format, the Event Viewer will only export the first 256 entries. The solution was to convert the Classic Event Viewer file with the .evt extension to an Event Viewer file with the .evtx extension. However, some .evt files we extracted did not properly convert into the new .evtx format; for instance, appevent.evt files are more likely to fail when converting. If these files have legitimate and readable entries before a faulty part, the Event Viewer will import these events under the classic style. However, when viewing events in the classic style, the Event Viewer only shows 256 events on the single page, and exporting these events causes only that page to be exported. To export the whole log, each page must be exported and reassembled manually.
The CAIDA Anonymized Internet Trace was captured by CAIDA's passive monitor on 21 January 2016 between 0500 and 0600 UTC (CAIDA, 2016). The traffic was from the Equinix-Chicago high-speed monitor located at the Equinix datacenter in Chicago, IL. The facility houses a backbone link for a Tier1 Internet Service Provider between Chicago, IL and Seattle, WA. The information was captured using Endace 6.2 Data Acquisition and Generation (DAG) cards. Although Endace boasts of 100% guaranteed packet capture (Endace, 2017), losses can occur at any later stage of the capture.
The data consisted of packets captured in tcpdump format (“pcaps”) that were compressed with the gzip utility. The information was anonymized and contained only OSI layer 3 and 4 data, IPv4, IPv6, TCP, UDP, and ICMP headers. The pcaps did not contain payload information. The captured traffic flow was bidirectional.
To import these files into Splunk we converted them from a binary tcpdump format to CSV format. We attempted two methods for conversion: Wireshark's data export tool, and TShark’s command-line interface. Initially, we converted the files using "Wireshark packet dissection export tool". This process was time-consuming as Wireshark is limited in the file size it can open and process. The average CAIDA pcap file is 1.4 GB and is too large for Wireshark; these files had to be broken down into 500 MB chunks before export. This process was very time-consuming, labor-intensive, and unsustainable. Ultimately, tcpdump was used to convert the bulk of the data. Tcpdump did not suffer from the same file size limitation as Wireshark. Additionally, because tcpdump is a command-line utility, a shell script could automatically parse the files.
Conversion from the binary tcpdump format to a CSV file increased the file size and was time-intensive. We recorded ten samples of conversion speed and size increase for analysis (see Figure 7). In the case of the CAIDA file conversion, the CSV file was on average 2.68 times larger than the binary pcap file. This happens because the CSV file encodes each number, special character, and letter as a separate character. Additionally, the CSV file adds spaces and delimiters to the file. Conversion takes a significant amount of time. On average, the testbed server converted 1.23 megabytes of the binary file per second, so 500 MB files took from 380 to 430 seconds.

Figure 7. Conversion resource consumption
Since our goal was to analyze data transfer between Splunk and Hadoop, we used the whole packet. Ultimately we likely will analyze only the timestamps and IP addresses for the captured packets. The average packet size in our sample was 1047.5 bytes. If we assume that most packets use the minimum header size for Ethernet frame (64 bits) and IP packet (20 bits) we could reduce the size of our data by the factor of 12. This would allow analysis of a greater number of timestamps with less overhead on disk space.
Hadoop is a collection of software for distributed processing and storage of large amounts of data. Hadoop operates on a cluster of nodes where the whole cluster operates as a single logical entity to provide a service. The nodes are computers with defined roles and they provide storage capacity and computation power. A computer designated as the cluster manager assigns roles and services to each node. Multiple nodes may serve in the same role and provide the same service.
The main benefit of Hadoop is the ability to scale from one computer to thousands of machines for increased storage capacity, redundancy, and processing power. Hadoop does not rely on expensive high-availability servers. Instead, it takes advantage of software-defined monitoring of the cluster of computers to provide high overall service availability even when individual nodes fail.
HDFS distributes multiple copies of the data across multiple machines. This preserves the data even when multiple nodes fail. HDFS can quickly ingest large amounts of data, especially when it ingests a few large files as opposed to many small files. The drawback of HDFS is a bottleneck at the NameNode manager when many files are transferred onto HDFS at the same time.
Many distribution packages for the Hadoop project are available. We chose Cloudera distribution for the testing because the basic version of its cluster management software is free and because the support forum for this distribution has many active contributors. It was easier to find solutions to implementation problems that arose in the process of installation and configuration of the cluster.
Different Hadoop distributions require different operating systems. Most commonly used variants of UNIX and Linux operating system can run Hadoop. Only two Hadoop distributions are known to the author that can run on Windows operating systems - Apache Hadoop 2.X (Apache, 2014) and Hortonworks Data Platform 2.X (Hortonworks, 2014). A possible solution for installing Hadoop on a Windows machine is to use a virtual machine hypervisor such as VMWare or Virtual Box. However, installing Hadoop on a virtual machine will significantly degrade performance and may be against organization policy in some cases.
The first task in our analysis of computer-log events was to understand the patterns of when events took place. Table 1 shows the distribution of sizes of the Event Viewer log files and presents the amount of data per country. This data was from Microsoft Windows computers that were using Event Viewer as the logging service. All of these log files were in the ".evt" or ".evtx" format. The number of event per log file varied from 2 to 231,681. Using this data, we aimed to discover time periods when events were logged at a higher or lower frequency than average.
Table 1. Amount of .evt Data per Location
|
Location |
Hosts |
Files |
Kilobytes |
Events |
|
Hong Kong |
1 |
2 |
2,236 |
3,335 |
|
Israel |
2 |
4 |
4368 |
826 |
|
Mexico |
27 |
46 |
766,566 |
929,039 |
|
Palestine |
2 |
4 |
2,830 |
2,770 |
|
Singapore |
1 |
3 |
81,997 |
122,666 |
We first graphed averages of events over time. Figures 8 through 12 show the graphs for the event data broken down by year, month, day of the month, day of the week, hour, and minute. Events were more common in 2005, in December, on the 16th of the month, on Wednesday, between 6 and 8 am, and in the middle of the hour. Events were least common in 2004, in July, on the 4th of the month, on Sunday, between 2 and 5 am, and at the end of the hour. Times during which an intermediate number of events were logged were on Monday, Tuesday, Thursday, and Friday, between 0800 and 1600 hours.
Initially, the focus was on the hours of the day when the least number of events took place, between 8 pm and 6 am. The Splunk search string to find these events is (date_hour>=20 OR date_hour<=6). A total of 94,235 events took place between these hours, 8.9% of all events. These events are interesting considering that this time period is 41.6% of the day. Of these events 6,162 happened on a weekend (date_wday=sunday OR date_wday=saturday). These computers were likely personal use home computers.
Interesting events that happened during these times were 29 failed logons (EventID 529). All these events belonged to five hosts from Mexico. Six events happened at a random time that did not show any pattern, but the other twenty three events happened in pairs, or in threes. The time difference between the first event and the second event in the pair was less than two seconds. We do not have an explanation for this pattern, but we can speculate that these login request were automated.
Figure 12 shows that 6 and 7 in the morning have significantly higher number of events compared to the other times. 40.184% of events happened during these hours. 210,535 events were logged between 0600 and 0659. 158,875 events were logged between 0700 and 0759. These numbers are two to three times higher than eight in the morning, which contains the third highest number of events. The reasons for this increase are EventID 560 (Object Access: Object Open) and EventID 562 (Object Access: Handle Closed). 11 computers from Mexico and 1 computer from Singapore were logging these events. After EventID 560 and 562 were filtered out, the distribution of events throughout the hours became more even.

Figure 8. Distribution of Events in Years[MD2]
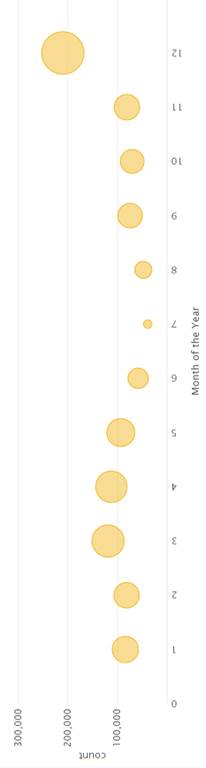
Figure 9. Distribution of Events During Months of the Year
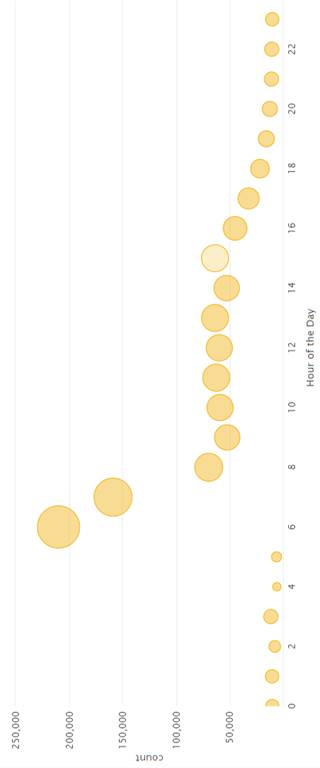
Figure 10. Distribution of Events During Hours of the Day
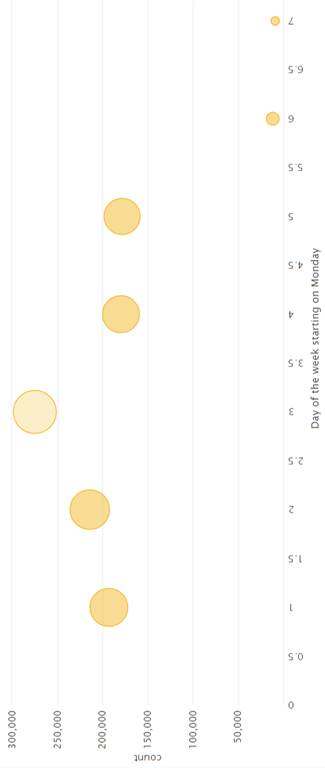
Figure 11. Distribution of Events During Days of the Week
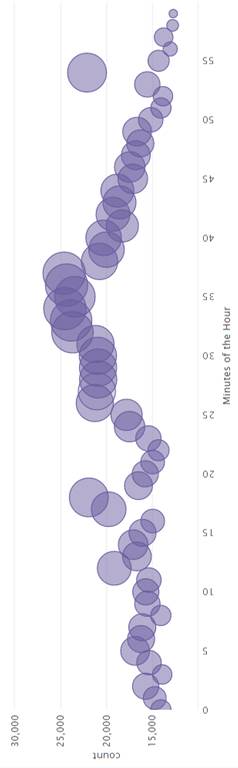
Figure 12. Distribution of Events During Minutes of the Hour
After analyzing rare events, we focused on the time periods with large number of events. December 2009 was the month with the largest number of events in the corpus with 122,935 events. Only one computer from Singapore was responsible for 96.7% of events that month. The two months with the next largest numbers of events were March and April 2006 with 95,422 and 85,381 events. These months were not interesting because 12 computers contributed a comparable number of events without any one host standing out.
117,486 events, or 95.7% of events generated by the host from Singapore were EventID 560 (Object Access). This log entry appears when Local Security Policy enables auditing of object access in Windows 2000 Server (Microsoft, 2017). The high rate of EventID 560 on this host is likely due to debugging, searching for malware, or misconfiguring settings and enabling "Audit the access of global system objects." The first EventID 560 appears on 12/15/2009 5:49:49 PM at which point these events are logged on average of one per second until 12/17/2009 1:58:13 AM. This is interesting because during other times this host only generated 4 events per hour on average.
Figure 13 shows Splunk graph of the total number of events for the host between 15 and 17 December 2009. In this graph, each column is an hour. We see that for several hours prior to 5 AM the amount of logged events was low. At 7 AM, the graph shows an increase in logs to over 3000 events per hour. This volume remains steady for 31 hours then decreases to the previous rate. This graph displays a period of significant increase in logged events and helps identify unusual activity.

We analyzed the starting and stopping of the logging services (EventIDs 6005 and 6006). We used search string "Event ID"=6005 OR "Event ID"=6006. These events may show attempts to hide activity by stopping the logging services. However, the analyzed images did not show any interesting patterns concerning these events as they were evenly distributed through the workdays and the average working hours of the day. 58.9% of computers were turned on between 0600 and 0900; 46.95% of computers were turned off between the hours of 1500 and 1800. The search for services starting or stopping during night hours or weekends did not reveal any unusual activity.
We combined [BC3] ".evt" and ".log" files to plot a timeline for top ten event-producing hosts. From all of our analyzed logs, Windows "secevent" was the top producer of events. This log file is responsible for recording security-related events in Windows 2000 and XP. Top ten hosts produced 1,027,857 events or 32% of the combined number of events. Nine of these hosts were from Mexico and one from Singapore. The length of activity from each host varied between 1 month and 13 months. The most frequent length of active time was 5 months. Each node remained at a steady level of event per time (Figure 14) except for SG1-1054 secevent. This was the host we mentioned earlier.

Figure 14. Timechart of top ten drive sources (2004-2013)
Figure 14 showed long periods of inactivity in the top ten hosts. We adjusted the timeline to focus on the period when the majority of these hosts were active, November 2004 to July 2006 (Figure 15). We did not discover any statistical anomalies in the number of logged events from the top 10 hosts.
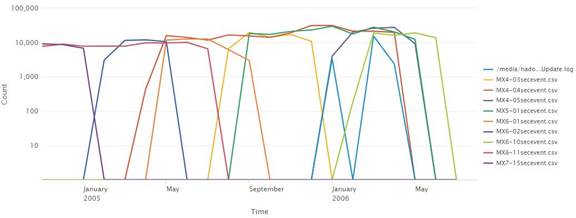
Figure 15. Timechart of Top 10 sources (2004-2006)
To increase the representation of the drives from different countries, we examined .log files as well as .evt and .evtx files. We focused on four types of .log files:
· wbemcore.log – Windows WMI service messages
· wbemess.log – Windows WMI service warnings
· windowsupdate.log – Windows Update Agent messages
· wmiprov.log – Windows WMI service management data
These files are in the ASCII format and have a timestamp at the beginning of each line. This allowed us to import them into Splunk without additional processing. Size of files varied from 47 bytes to 8.5 megabytes. Table 1 shows the distribution of log files by type.
Table 2. Log file distribution
|
Log File |
Total Files |
Empty Files |
Imported files |
Imported size |
|
|
|
wbemcore.log |
836 |
101 |
735 |
7.6 MB |
||
|
wbemess.log |
810 |
98 |
712 |
20.5 MB |
||
|
windowsupdate.log |
836 |
121 |
715 |
295.7 MB |
||
|
wmiprov.log |
838 |
95 |
743 |
14 MB |
||
These log files originated in machines from around the world. Table 3 shows the distribution of logs per location in tabular format. Figure 16 shows data distribution per location in a bar chart format.
Table 3. Amount of .log Data per Location
|
Location |
Hosts |
Files |
Size |
Events |
|
UAE |
64 |
256 |
25 MB |
371,485 |
|
Australia |
1 |
4 |
2.7 MB |
2,224 |
|
Bahamas |
15 |
58 |
21 MB |
33,599 |
|
Canada |
4 |
14 |
4.3 MB |
15,128 |
|
China |
6 |
36 |
4.6 MB |
618,782 |
|
Czech Rep |
2 |
6 |
1.5 MB |
2 |
|
Germany |
3 |
12 |
3.5 MB |
567 |
|
Egypt |
4 |
15 |
3.2 MB |
129,926 |
|
Ghana |
2 |
5 |
3.2 MB |
1 |
|
Honk Kong |
4 |
16 |
2.1 MB |
2803 |
|
Israel |
60 |
240 |
82 MB |
874,835 |
|
India |
339 |
1355 |
79 MB |
228,018 |
|
Japan |
1 |
4 |
65 KB |
17 |
|
Morocco |
10 |
39 |
475 KB |
565 |
|
Mexico |
34 |
134 |
11 MB |
50,268 |
|
Malaysia |
8 |
32 |
7.8 MB |
243 |
|
Panama |
5 |
20 |
2.8 MB |
11,657 |
|
Pakistan |
2 |
8 |
668 KB |
95 |
|
Palestine |
68 |
271 |
36 MB |
127,617 |
|
Serbia |
14 |
56 |
11 MB |
517 |
|
Singapore |
16 |
62 |
11 MB |
1,432 |
|
Thailand |
49 |
194 |
11 MB |
450 |
|
Turkey |
7 |
26 |
6.1 MB |
384 |
|
Ukraine |
2 |
7 |
1.7 MB |
134 |

Figure 16. Data distribution per Country
The distribution of events over time (Figure 17) shows that the number of events spiked in August 2006, January 2010, June 2010, October 2010, and March 2011.

Figure 17. .log Event Distribution over Time
We correlated the number of events in the log files to the number of Microsoft updates released per month from November 2009 to May 2011. Figure 18 shows the graphical representation of the number of Microsoft updates and the number of events in the log files. Visual analysis of the graph suggests little to no correlation between the number of updates per month and the number of events per month. The correlation coefficient between the two number distributions is -0.123. It confirms that the four logs we analyzed do not have a correlation with the Microsoft Updates.

Figure 18. Distribution of Log Events and Microsoft Updates
Doing a similar correlation between the number of events and the number of active sources, meaning more computers were operating at this time. We see that the graphs follow similar trends (Figure 19). The correlation coefficient between the two distributions is 0.7478 indicating strong positive correlation. This suggests that only an increase in the number of computers producing the logs caused the spikes in the number of events.
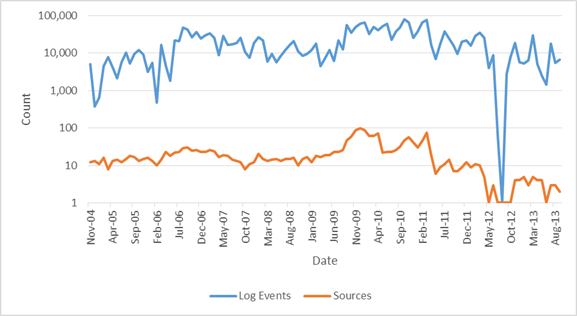
Figure 19. Distribution of Log Events and Sources
We tested three drives to discover patterns across logs of a single host. We randomly chose a drive from UAE, India, and Palestine. Table 4 contains statistical data about each drive including the number of the months during which the computer produced events. We imported these log files into Splunk automatically. Some log files were binary, some had non-standard timestamps, and some did not have timestamps at all. As a result we could not process some events from each of the host and discarded them.
|
Location |
Files |
Size |
Total Events |
Useful Events |
Months Active |
|
UAE |
120 |
29.2 MB |
34,718 |
24,019 |
6 |
|
India |
136 |
33.6 MB |
81,577 |
73,665 |
4 |
|
Palestine |
185 |
14.2 MB |
63,438 |
49,188 |
36 |
The three computer were used differently and produced very different timecharts. The drive from UAE was likely using Windows XP Service Pack 1 because setupapi.log and install.log specify this operating system. We inferred that the host started operating in April 2010 because "install.log" and "setupapi.log" were most active during this period and most events occurred after this time. There were 116 events belonging to this host prior to April 2010 belonging to a single "error.log" file. We believe that the service responsible for this file had incorrect time configuration. This host was most active between 13 April and 5 September, 2010. During this time, it produced 23,928 or 99.8% of events.
The most active log was netstat4.log. In 1 hour and 22 minutes, it logged 6,141 or 60.9% of events on this host. Most events were of little interest, such as communication establishment between computers on the same private subnet. Some log entries showed communication with the computer's ISP registered in Mumbai, accessing video streaming services, and browsing web pages using Firefox. The log activity on this computer shows a diurnal pattern with high activity between 8:00AM and 11:00AM, a drop in activity between 12:00PM and 2:00 PM, and another rise in activity between 2:PM and 7PM. We assume that this computer was used as a work computer, with user working from 8:00AM to 7:00PM with a two hour break for lunch.

Figure 20. UAE Drive Timechart
Figure 20 shows a sharp rise in activity in September compared to the other months. This is due to netstat4.log producing a large amount of events in a short period; he owners of the drive seem to have been doing troubleshooting on the machine. This is evidenced by the presence of FTK Imager, a forensics disk-imaging toolkit (AccessData, 2017), and by turning on the "netstat" logging service. The reason for this activity is unknown as we have not discovered any log entries pointing to a virus infection or other security-related problems.
The drive from India was likely using Windows XP because update logs record installing Windows XP Service Pack 2. This drive was most active between 21 January and 17 February 2010 when it produced 73,665 or 90% of events. Out of 74 log files on this machine, AVG antivirus software (AVG Technologies, 2017) produced 38 log files containing 64,373 or 87.4% of useful events. Despite a large number of AVG logs, we did not find any viruses or malicious activity on this drive.
This computer was used mainly between the hours of 9:00PM and 2:00AM, 54.5% of events happen in these 6 hours. This suggests it was a home computer for personal use. Besides AVG antivirus, the computer had Yahoo Messenger as evidenced by "ycp_user.log". All other logs were generic Microsoft Windows logs with no unusual activity.
The drive from Palestine was likely using Windows 2003 Service Pack 1 because update logs record installing Windows 2003 security updates, resource kits, and regular updates. This drive was active the longest time of the three. However, periods of activity varied greatly between each month. The maximum number of events during these months was 10,770, with a minimum of 2, a mean of 1525, and a median number of 1229. Windows Update services were the majority of the events logged on this computer. The miscellaneous update logs took 23.015 or 46.8% of the useful events.
The computer was used mainly between 8:00AM and 4:00PM. However, the number of events recorded during this time was only three to four times greater than during periods of low activity. We believe this computer was used as a web server because it has an iis5.log file. This file belongs to Microsoft Internet Information Services version 5. Additionally, in the log we see references to the local directory which hosted the web site. This computer was not in continuous operation throughout the six years of service. It was turned on only sporadically.

Figure 21. Palestine Drive Timechart
Figure 21 shows the timechart of events on the drive. The small spikes in activity throughout the chart are the IIS service being active. The spike in March 2005 is a result of cleaner.log recording 8,378 events during that month. Microsoft Antispyware created this log to record scan times and removed or quarantined malicious files. This program does not come standard with Windows 2003 and needs to be downloaded and installed. We believe this program was installed at 3:39PM on 2 March 2005 because that was the time of the program's first recorded event. Within 10 minutes, the program deleted 3,930 files, 11 folders, and 4,315 registry keys and values. After the initial burst, the log recorded only four events per day. The program ran automatically at 2:08AM every day until July 2005.
In addition to IIS and antispyware software, this drive had Lotus Word Pro word editor as evidenced by the presence of lotunin.log. However, the owner removed the program on 7 October 2002.
We conducted two experiments to test Hadoop transfer efficiency. In the first experiment, we transferred 50 GB, 100 GB, and 200 GB of CAIDA packet-capture data between the Hadoop cluster and the Splunk Server using Hadoop Command Line Interface (CLI). We used this data in the second experiment as a data input for Splunk.
The Hadoop servers and the Splunk server were connected to the same switch and were physically located in the same building. The total cable length between the servers was less than 100 meters. The network interface card speed on all servers was 1 gigabit per second. The roundtrip time between the computers was tested using ICMP pings and was on average 0.204 milliseconds.
In the first experiments we transferred data from the Splunk server to the Hadoop cluster using the <hadoop fs –copyFromLocal> command. This command was ran on the Splunk server. This command is a part of the Hadoop CLI and allows other computers to communicate with the Hadoop cluster. The average speed to transfer data from Splunk server to Hadoop cluster was 81.35 megabytes per second. Figure 20 shows the results from the three data transfers from Splunk server to Hadoop cluster.
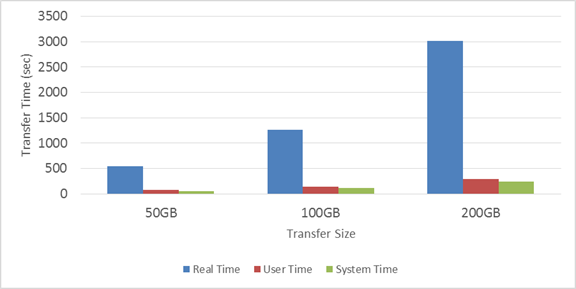
Figure 22. Data transfer time from Splunk server to Hadoop cluster
In the second experiment we, we transferred data between the Splunk server and the Hadoop cluster using Splunk Hadoop Connect Build Export tool and Manage HDFS Inputs tool. This experiment involved two tasks. In the first task, we exported data from the Splunk server's internal index to the Hadoop cluster using Build Export tool. This tool was able to export data in the raw, CSV, XML, or JSON formats. We chose the raw format because it is the default format for Splunk. The data was verified using Splunk Hadoop Connect and Hadoop CLI to ensure the export was successful.
We selected the data to transfer to Hadoop using a custom search of Splunk index and setting up a scheduled export to the specified cluster and specified folder on the HDFS. Because the export is scheduled and automated, we wanted to transfer logs that were periodically updated. We chose to test export with the failure and error messages on the Splunk server instead of the static data we extracted from the Real Data Corpus and from CAIDA network traffic logs. We used the <host="ubuntuhadoop" source="/var/log/syslog" (error OR fail*)> search string to find the events we wanted to export. The export was successful. We were able to set up automatic data transfer from the Splunk server onto the Hadoop cluster.
The second task was to import data into Splunk for analysis from the Hadoop cluster using Add Data Input tool. The CAIDA packet capture data that was transferred to the Hadoop cluster during phase one was added as an input into Splunk Hadoop Connect application. The Manage HDFS Inputs tool was set up to import data from the three folders set up in phase one. The transfer was timed and analyzed for efficiency of transfer and effectiveness of finding and presenting event data.
The index search on the Splunk server for the Event Viewer log data consisting of 1,058,635 events took on average between 12 and 15 seconds. Each request to filter search data or modify a search parameter within Splunk took less than 5 seconds. The time to change the graph style (bar, line, pie, and bubble chart) was almost instantaneous.
The average speed to split the CAIDA 1.2 GB pcap files into 500MB files was 60.77 megabytes per second. The average speed to convert pcap files from binary format to a CSV format was 1.2 megabytes per second. We created two shell scripts to automate the time-intensive process of splitting and converting the files. The script is available in Appendix B. We timed these scripts with the “time” command. Figures 21 and 22 show the time splitting and converting took.
Index search on the Splunk server for CAIDA traffic log data had to be measured differently because of the large number of events. The 200GB CAIDA log contained 1,302,367,570 events. On average, the Splunk server could present results for 5,944,109 events in one minute.
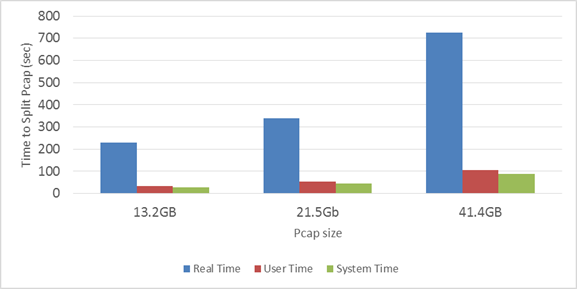
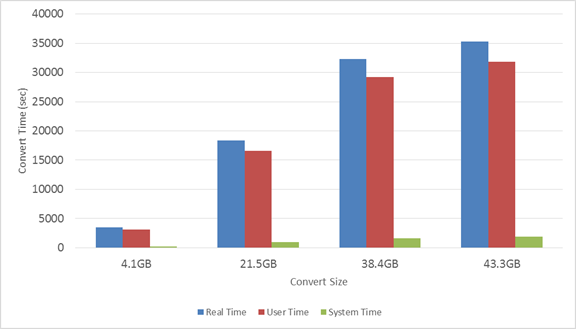
Figure 24. Binary to CSV conversion time
In this research, we were unable to measure the speed of searching using Hadoop distributed computing and MapReduce algorithms. Splunk Analytics for Hadoop app is required to conduct such a benchmark test. However, we can estimate the speedup. When Splunk Analytics for Hadoop searches for data, it tries to break up the search into parallelizable parts. The program first analyzes the search job and takes out the parts that cannot be run in parallel. Then parallelizable commands and the first non-parallelizable command become the "map" function of the MapReduce algorithm. The rest of the commands become the "reduce" function (Sorkin, 2011). The "map" function is generally done on the nodes where the data resides and runs in parallel. The "reduce" function takes the output from the "map" function and processes the information without parallelization.
When Splunk Enterprise searches for data, it creates a search "job" on the Splunk server. This search job is responsible for all of the underlying actions that take in the data and produce the output. These actions include reading the data, allocating disk space for the intermediate search results, and generating results. The search job keeps execution cost metrics for each job in the Job Inspector. Important metrics for performance evaluation are <dispatch.stream.local> and <dispatch.fetch>. <dispatch.stream.local> shows the total time that the search took on the server. <dispatch.fetch> shows the "time spent by the search head waiting for or fetching events from search peers" (Splunk Inc., 2017, pp. 224-226). We can think of the time shown in <dispatch.fetch> as the time for the "map" function. The time difference between the two times can be viewed as "reduce" function.
When we searched for all of the events in the Event Viewer log data, the <dispatch.stream.local> time to process 1,058,635 events was 28.76 seconds and <dispatch.fetch> time was 7.33 seconds. The fetching rate was 144,425 events per second. We assume that this part is parallelizable. The time difference is 20.43 seconds. We assume this time was taken by other processes and is not parallelizable. This search was done on a single computer. A similar search on a Hadoop cluster would incur networking delays as well as MapReduce scheduling delays.
If we assuming that the non-parallelizable time to display the fetched results remains constant, the time to fetch the results and to process the results on the local server would be equal if we process 2,950,602 events. If we assume that similar machines are used in the Hadoop environment and it takes one second to do network communication and to set up MapReduce jobs, the search time on the Hadoop cluster would be the same as the search speed on the local Splunk server if we process 3,095,460 events.
Using our testing methodology and our assumptions, we
conclude that for a single computer the search time is ![]() formula where n is
the number of events produced by the search. If we have several nodes that can
parallelize the search, the formula becomes
formula where n is
the number of events produced by the search. If we have several nodes that can
parallelize the search, the formula becomes ![]() where k is the
number of nodes in the cluster and x is the network communication and MapReduce
time. So we believe there will be a close to a linear speedup with data size.
where k is the
number of nodes in the cluster and x is the network communication and MapReduce
time. So we believe there will be a close to a linear speedup with data size.
THIS PAGE INTENTIONALLY LEFT BLANK
Using Splunk, we were able to analyze log data consisting of computer Event Logs as well as network traffic logs. We were able to find basic statistical information about the computer log data from the forensic corpus. We were able to create a histogram of event over time, determine the time when the events were likely to occur, and identify unusual times and patterns for the events.
Splunk is good at presenting data in different formats. Using Splunk, we were able to produce various types of charts. These charts allowed us to quickly understand time patterns of events and focus on unusual times or interesting events. Additionally, these charts can present technical information to people without a technical background to help explain data analysis and to help in the decision-making process based on this analysis.
Splunk Hadoop Connect is an effective way to transfer data between Splunk server and Hadoop Cluster. The parameter setup for transfer on Splunk Hadoop Connect is easy and does not require a steep learning curve. Adding data from HDFS as an input for Splunk is easy as well. After the setup is complete, the transfer process is automatic and can be set up to run at periodic times.
Splunk's ability to interact with a Hadoop cluster using Splunk Hadoop Connect and Splunk Analytics for Hadoop allow the researchers to harness the distributed storage and processing. Hadoop's MapReduce ability can allow Splunk to search extremely large amounts of data and potentially provide a near-linear speedup in processing time.
Converting files from binary format to CSV format was time- and space-consuming. A system or a network generating more than 10 gigabytes of binary data per day would have to spend hours on the conversion process. These CSV files were larger than binary files. Although hard-drive storage is fairly cheap, CSV files will take over 2.5 times the size of binary files. Besides direct impact on local storage, this size increase will increase space requirements on the backup medium and load on the network to transfer this data. A recommended solution is to record data directly into Splunk using a built-in app that supports the binary format of the log service required for monitoring.
Hadoop distributions run mainly on UNIX-type operating systems. Although two Hadoop distributions are available for Windows, most documentation and support forums focus on UNIX and Linux operating systems. Hadoop requires a steep learning curve and knowledge of UNIX-type OS. Most governmental organizations operate on Windows-based networks (U.S. Government, 2017) and may not have an extensive UNIX knowledge base.
Splunk Hadoop Connect is only able to transfer the data. Splunk Analytics for Hadoop is required to conduct searches and data analysis on Hadoop. This application requires a separate license and an additional minimum fee of $30,000 per year (Splunk, 2016) and we were unable to test it.
This research used data generated by external sources that varied in geographic location and time. This data does not lend itself to correlation of events across a single homogeneous system where events on one machine affect another machine. A better test could involve data from a honeypot with a public-facing IP address. The honeypot servers could also have a few publicly-available services such as Web servers, SSH, and SQL monitored by the computer's event-log service.
Splunk Analytics for Hadoop is a way to analyze data on the Hadoop cluster. A Splunk sales representative has provided us with a trial license for Splunk Enterprise. If the sales representative is able to provide NPS researchers with a Splunk Analytics for Hadoop license, the Hadoop cluster that is currently set up could be used to test parallel searches and distributed data processing capabilities of Hadoop.
Future work could include log analysis using free tools like Log2timeline/Plaso (Plaso, 2016) or Elasticsearch Logstash Kibana (ELK) (Elasticsearch BV, 2017). These tools are open-source and freely available for download. They run on CentOS and Ubuntu operating systems, which are also free.
The Hadoop community has various log analysis tools that can be tested. Cloudera distribution provides Apache Kafka, Cloudera Search, and Hue (Shapira & Shmain, 2015), Hortonworks provides similar capability with DataFlow and Apache Zeppelin (Hortonworks Inc., 2017). These tools could be used to analyze the data directly on the Hadoop cluster without exporting the data to a different server.
The Hadoop cluster that was set up for this thesis consisted of five commodity servers. Each server had a Red Hat Enterprise Linux as an operating system and Cloudera 5.9.1 as Hadoop manager. The Splunk server used in this thesis had an Ubuntu 16.04.2 operating system and Splunk Enterprise 6.5.2. The servers were connected according to the diagram in Figure 23.
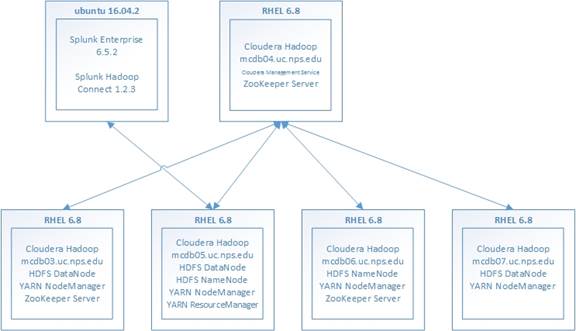
Figure 25. Testbed Connection Diagram
Two types of servers were used in the project (See Table 3).
Table 4. Testbed Hardware Specifications
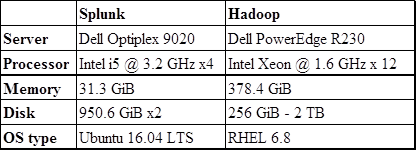
Correct configurations for static IP addresses, server hostnames, and firewall permissions are essential to reduce communication errors between the Splunk server and the Hadoop cluster. Hostname to IP address resolution must be correctly configured in resolv.conf file on each server within the Hadoop cluster. Each member of the cluster must have a record of the hostname and the IP address of all servers in the cluster. These records are typically held in /etc/hosts file. Firewall on each server must be configured to allow communication between all other members of the cluster and the Splunk server. Typical firewalls on UNIX and Linux are iptables or firewalld.
We used the following commands to download and install Cloudera Manager:
· curl -O http://archive.cloudera.com/cm5/installer/latest/cloudera-manager-installer.bin
· chmod +x cloudera-manager-installer.bin
· ./cloudera-manager-installer.bin
· Use the defaults for the installation
· yum install cloudera-manager-server-db-2
Splunk Enterprise 6.5.2 was installed on Ubuntu 16.04 LTS operating system using the following method:
· Using web browser, we downloaded the latest version of Splunk from https://www.splunk.com into the Downloads folder. The filename in this case was splunk-6.5.2-67571ef4b87d-Linux-x86_64.tgz.
· Using the terminal, we changed current directory to /Downloads and install Splunk using the following commands:
· cd Downloads/
· sudo tar –xvf splunk-6.5.2-67571ef4b87d-Linux-x86_64.tgz –C /opt/
· cd /opt/
· cd splunk/bin/
· sudo ./splunk start –accept-license
· sudo ./splunk enable boot-start
At this point Splunk was ready to use. Using a web browser, we navigated to localhost:8000 and input the first-time login information of Username: admin and Password: changeme.
The instructions on Splunk Hadoop Connect setup are available at: http://docs.splunk.com/Documentation/HadoopConnect/latest/DeployHadoopConnect/AboutSplunkHadoopConnect . Additional video tutorials are available at https://splunkbase.splunk.com/app/1180/#/details.
The Splunk Hadoop Connect testbed for this thesis was set up by downloading the setup file from https://splunkbase.splunk.com/app/1180/ and then from the Splunk server homepage, clicking on the Manage Apps icon, then “Install app from file,” then browsing to the downloaded file and select it, then “Upload.” Splunk will require a restart after the application installation.
After the setup was complete, HDFS was rejecting data exports from Splunk Hadoop Connect. HDFS permissions were preventing a connection. HDFS permissions are separate from the host operating permissions for files and folders. To view the HDFS permissions current user had to be changed to HDFS user using su hdfs command. Then the folder had to be created and permissions had to be changed using commands in Figure 24.
The Splunk Hadoop Connect HDFS Export did not always export indexed data from the Splunk server to HDFS. One key issue is the time window on the data for the export. This option is available during the Setup HDFS Export dialog. The date needs to be picked carefully to avoid empty results.
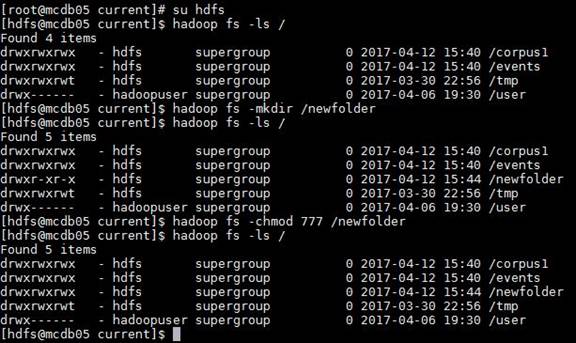
#!/bin/bash
# change the path names if necessary
input_location='/media/hadoopuser/DATAPART11/CAIDA2016/split/*'
#output_location='/media/hadoopuser/DATAPART11/CAIDA2016/test2/'
tcpdump_cmd='tcpdump'
tcpdump_options='-C 500'
for file in $input_location
do
echo "processing file: $file"
#echo "$tcpdump_cmd -r $file $tcpdump_options -w $output_location$file.pcap"
$tcpdump_cmd -r $file $tcpdump_options -w $file.reduced.pcap
done
echo "Splitting complete"
#!/bin/bash
#change the path names if necessary
#convert_files='/media/hadoopuser/DATAPART11/CAIDA2016/convert/*.reduced.pcap*'
convert_files='/media/hadoopuser/DATAPART11/CAIDA2016/convert/*'
tshark_cmd='tshark'
tshark_options='-e frame.number -e frame.time -e ip.src -e ip.dst -e ip.proto -e frame.len -e_ws.col.Info -T fields -E separator=, -E quote=n'
for file in $convert_files
do
echo "processing file: $file"
$tshark_cmd -r $file $tshark_options > $file.csv
done
echo "Results in: $outfile ..."
THIS PAGE INTENTIONALLY LEFT BLANK
Allen, S. (2001). Importance of Understanding Logs from an Information Security Standpoint. SANS Institute, 1-14. Retrieved from https://www.sans.org/reading-room/whitepapers/logging/importance-understanding-logs-information-security-standpoint-200
Apache. (2014, August 27). Build and Install Hadoop 2.x or newer on Windows. Retrieved from Hadoop Wiki: https://wiki.apache.org/hadoop/Hadoop2OnWindows
Apple Inc. (2004). Syslog manual. Cupertino, CA.
Apple Inc. (2007). ASL Manager Manual. Cupretino, CA.
CAIDA. (2016, March 4). The CAIDA UCSD Anonymized Internet Traces 2016. Retrieved from http://www.caida.org/data/passive/passive_2016_dataset.xml
Elasticsearch BV. (2017). Open Source Search & Analytics. Retrieved from Elastic: https://www.elastic.co/
Endace. (2017, March 4). The genius of DAG. Retrieved from Endace: https://www.endace.com/endace-dag-high-speed-packet-capture-cards.html
Federal Motor Carrier Safety Administration. (2015, December 10). Electronic Logging Devices and Hours of Service Supporting Documents. Federal Rule.
FTC. (2006, April). Financial Institutions and Customer Information: Complying with the Safeguards Rule. Retrieved February 28, 2017, from Federal Trade Commission: https://www.ftc.gov/tips-advice/business-center/guidance/financial-institutions-customer-information-complying
Hortonworks. (2014, January 21). How to Install Hadoop on Windows with HDP 2.0. Retrieved from Hortonworks: https://hortonworks.com/blog/install-hadoop-windows-hortonworks-data-platform-2-0/
Hortonworks Inc. (2017). Internet of Things and Big Data Analytics with Hortonworks DataFlow. Retrieved from Hortonworks: https://hortonworks.com/products/data-center/hdf/
IT Management. (2017, February 28). Company Profile: Splunk. Retrieved from IT Management: http://static.itmanagement.com/vendors/profile-splunk/
Microsoft. (2009, May 7). Event Logs and Channels in Windows Event Log. Retrieved February 28, 2017, from Microsoft Developer network: https://msdn.microsoft.com/en-us/library/aa385225.aspx
Microsoft. (2011, August 5). WMI Service. Retrieved from TechNet: https://technet.microsoft.com/en-us/library/dd363658(v=ws.10).aspx
Microsoft. (2017, March 29). Event IDs 560 and 562 appear many times in the security event log. Retrieved from Microsoft: https://support.microsoft.com/en-us/help/841001/event-ids-560-and-562-appear-many-times-in-the-security-event-log
NIST. (2006). Guide to Computer Security Log Management. NIST special publication, 800-92, pp. 2-1.
Oliner, A., & Stearley , J. (2007). What supercomputers say: A study of five system logs. IEEE proceedings of International Conference on Dependable Systems and Networks (DSN’07), (pp. 575-584).
Oliner, A., Ganapathi, A., & Xu, W. (2011). Advances and Challenges in Log Analysis. ACM Queue.
Plaso. (2016, September 18). Home - log2timeline/plaso. Retrieved from GitHub: https://github.com/log2timeline/plaso/wiki
Riverbed. (2017). Retrieved December 6, 2016, from About Riverbed: https://www.riverbed.com/about/index.html
Roberts, C. (2013, July 10). Discovering Security Events of Interest Using Splunk. SANS Institute InfoSec Reading Room. Retrieved from https://www.sans.org/reading-room/whitepapers/logging/discovering-security-events-interest-splunk-34272
Rowe, N. C. (2016). Identifying forensically uninteresting files in a large corpus. EAI Endorsed Transactions on Security and Safety, 1-15.
Saidi, R. M., Ahmad, S. A., Noor, N. M., & Yunos, R. (2013). Windows Registry Analysis for Forensic Investigation. Technological Advances in Electrical, Electronics and Computer Engineering (TAEECE), 2013 International Conference, (pp. 132-136).
Sawmill. (2016, December 3). Sawmill. Retrieved from Sawmill: http://www.sawmill.net
Shapira, G., & Shmain, J. (2015, February 27). How-to: Do Real-Time Log Analytics with Apache Kafka, Cloudera Search, and Hue. Retrieved from cloudera.com: http://blog.cloudera.com/blog/2015/02/how-to-do-real-time-log-analytics-with-apache-kafka-cloudera-search-and-hue/
Solarwinds. (2016, December 3). Solarwinds. Retrieved from Solarwinds: http://www.solarwinds.com
Sorkin, S. (2011). Large-Scale, Unstructured Data Retrieval and Analysis Using Splunk. San Francisco, CA, US.
Speece, F. (2016, October). Detecting Penetration Testers on a Windows Network with Splunk. SANS Institute InfoSec Reading Room. Retrieved from https://www.sans.org/reading-room/whitepapers/logging/detecting-penetration-testers-windows-network-splunk-37367
Splunk. (2016, November). FAQ: Hadoop Data Roll and Splunk Analytics for Hadoop.
Splunk. (2016, August 16). Splunk Enterprise Chosen as Analytics Platform for New IT Architecture at Cardinal Health. Retrieved December 3, 2016, from Splunk: https://www.splunk.com/en_us/newsroom/press-releases/2016/splunk-enterprise-chosen-as-analytics-platform-for-new-it-architecture-at-cardinal-health.html
Splunk. (2017, February 28). Splunk. Retrieved from Splunk: http://splunk.com
Splunk Inc. (2017). Splunk Enterprise Search Manual 6.6.0.
TZWorks. (2017). Yet Another Registry Utility. Retrieved from TZWorks: https://www.tzworks.net/prototype_page.php?proto_id=3
U.S. Department of Defense. (2011, September 6). DoD IT Enterprise Strategy and Roadmap. 800, p. 113.
U.S. Government. (2017, May 2). analytics.usa.gov. Retrieved from analytics.usa.gov: https://analytics.usa.gov/
Venčkauskas, A., Damaševičius, R., Jusas, N., Jusas, V., Maciulevičius, S., Marcinkevičius, R., . . . Toldinas, J. (2015). Investigation of Artefacts Left by BitTorrent Client in Windows 8 Registry. Information Security and Computer Fraud, 3(2), pp. 25-31. Retrieved from http://pubs.sciepub.com/iscf/3/2/1
Wireshark. (2107). About Wireshark. Retrieved December 6, 2016, from Wireshark: https://www.wireshark.org/about.html
Yahyaoui, A. (2014). Testing Deceptive Honeypots. Monterey, CA: Naval Postgraduate School.
THIS PAGE INTENTIONALLY LEFT BLANK
1. Defense Technical Information Center
Ft. Belvoir, Virginia
2. Dudley Knox Library
Naval Postgraduate School
Monterey, California
[MD1]You may want to review your abstract to make sure it’s doing everything for your thesis that it can! The ideal abstract should give your hypothesis and (brief) supporting background, your methods, findings, conclusions and recommendations. It is usually written after the thesis is completed, so all elements can be included.
[MD2]I will place this image on a landscape page at final review.
[BC3]Plotting times for individual drives. These are the top 10 drives for the time period.
[BC4]In-depth analysis of three drives
[MD5]You will need to remove the coding (the box) on the List of References and edit each entry before final review. The document titles should be in sentence case and be sure to include all required information (for example, the publisher should be added to the Apple entries, and if the publisher is Apple, then the word “Author” should stand in where the publisher would normally be. Check for typos and misspellings, for example “Cupretino” on the fourth entry.
At least 85% of the entries here must be complete and formatted according to APA style to prevent delays at final review.
Please refer to http://libguides.nps.edu/citation/apa for examples and other APA guidance.