1.0 Introduction
Small unit operations are often
fast-paced and resource-constrained, and can often end up in situations where
the safety of the unit as a whole rests on the shoulders of a watchful team
member. For example, Army Special Forces, Navy Special Warfare, and Marine
Corps Special Operations often deploy four-man teams deep in enemy territory
for extended periods of time. Likewise, soldiers could be tasked to operate
beyond the immediate protection of their unit, acting as an� Observation or
Listening Post where the team could be as small as two individuals. Fatigue may
inevitably degrade the team�s situational awareness. In such situations, the
team risks ambush by the enemy, leading to loss of life or property. Such
situations are also common in distributed warfighting where small units conduct
operations in remote, austere environments where security is completely
organic. The demand for technology-enhanced situational awareness is warranted
for both the unconventional and conventional levels.
It would be helpful for the unit to be
equipped with a lightweight low-power surveillance capability that could raise
an alert to the imminent danger in the vicinity. Such an alert could be raised
as soon as a suspicious entity is detected within the range of the
surveillance. From a practical point of view such a capability should be
implemented without introducing significant additional weight, should use as
little power as possible, and should be quick and easy to install and operate.
We are working on a system using current
smartphone technology to provide this lightweight and low-power sensor. Modern
smartphones use a series of accelerometers to detect the movement and
orientation of a phone. To date this information has been used to flip screens
from vertical to horizontal orientation and in gaming applications to simulate
activities like driving a car or flying a plane.� We are testing the
sensitivity and accuracy of this accelerometer data. The accelerometer can be
sampled over a hundred times a second, displaying microchanges in the
gravitational pull on the device/ These microchanges represent small vibrations
in the phone. When affixed to the ground, the vibrations caused by footsteps
and vehicles register as these microchanges in the accelerometer data. �In
addition, all phones are equipped with microphones for making phone calls.
Smartphones can be programmed to interpret the sound received in decibels.
Sound signals can also be sampled at over a hundred times a second. Sound can
be another detection device for our sensors. By combining the two, we increase
the accuracy of intruder detection.
1.1 Smartphone Applications
The use of advanced smartphone
functionality requires the programming of applications to interface with
operating system and hardware. Our applications focus mainly on the accelerometer
and microphone. �Using Objective-C and the IPhone SDK we have developed a
sentry application and a base-station application to create alerts and transfer
them to friendly lines.
1.1.1 Sentry Application
The sentry application is loaded on the
device that is placed forward of friendly lines. The application provides the
following features.
a.�� Capture and analysis of the accelerometer
and microphone data to make the determination as to whether there is movement
in the vicinity. The device will have the option to give an alert siren or to
create a silent alarm.
b.� Ad hoc networking via Bluetooth. Currently
smartphones do not have the built-in ability to act as Wi-Fi hotspots.
Therefore, Bluetooth is necessary for our networking. The system is designed to
be used where there will be no other coverage. The sentry application will
communicate with the master device to transfer alarms silently from the sentry
application to the main application.
1.1.2 Base Station Application
The base station application will be kept
inside friendly lines and will communicate with the sentry devices and provide
the user with the following features:
a. The user will be able to choose the
number of sentry devices to deploy. When the user chooses the number of
sentries they have deployed, an active sentry screen will be displayed that
will reflect the deployment configuration. The display links graphics on the
base station to the Bluetooth-connected devices, so when an alert is received
the corresponding graphic will let the user know which device registered the
alarm.
b. The base station will act as the
server in the ad hoc Bluetooth network. This will allow multiple devices to
connect to the base station.
c. The user will be able to choose how
they wish to be alerted on an alarm. They will be able to choose an alarm or
just a visual alert. Different situations will warrant a silent or auditory
alarm, as will be discussed further in this paper.
1.2
Objectives
Our primary objective in this research
area is to determine the accuracy of smartphone accelerometers and microphones
and their abilities to detect the presence of movement. Our secondary objective
is to determine if the Bluetooth networks are reliable enough to create an ad hoc
network and transfer alerts to a human sentry. This work will show the
usefulness of this type of application. Our objective is not to endorse any
particular type of smartphone. It is to show that any smartphone with an
accelerometer and microphone installed has the capabilities to be a sensor, and
an application could be added to it with little to no cost.
1.3 Smartphone Required Capabilities
For the smartphone to be able to act as a
sensor in the manner we propose, it must provide the following capabilities for
data collection:
Three accelerometer values:
���������������������������� X, Y, and Z-axis
Sampling: �������������������������������������������������������� 100
samples per second
Alert: �������������������������������������������������������������� Audio
playback for auditory alarm
Data Transfer: ������������������������������������������������ Bluetooth
capability to connect to server device
Sound Recording:��������������������������������������������� A
microphone that can convert signal to Db
2.0 Accelerometer and Filtering
Our experiments used the Apple IPhone
3GS. We used unlocked versions to facilitate data transfer during testing
phases. The IPhone uses the LIS302DL accelerometer. The LIS302DL has
dynamically selectable full scales of � 2g/� 8g, and it is capable of measuring
accelerations with an output data rate of 100 Hz �or 400 Hz. In testing it was
noted that at 100 HZ we were getting, on average, 98 readings per second.
Sampling at higher rate than 100 Hz may be capable with the LIS302DL but the
ability to track, process, and write the received data will cause the iphone to
drop readings. The ability to detect footsteps does not require more than 100
Hz.
Our
current implementation has not fully put all data processing on the device. We
have found it necessary to store the data and move it off the device for
processing. Currently 100 values per second are written to a text file and this
text file is transferred off the device to allow us to levy the power of
programs like Matlab and Octave to process the data.� We are searching for the
best data filtering we can find; this will then be implemented onto the device
so the device can filter the data as it comes in and make instantaneous
decisions on alerts.
2.1 Objective C Accelerometer
Access
To understand the capabilities of the
IPhone it is necessary to review how the IPhone uses Objective C and COCOA to access the phones hardware. Objective C imports frameworks in similar fashion to
Java and other object-oriented languages. Where Java has Application
Programming Interfaces (API) ito interface with different hardware devices,
Objective C has "delegates". The delegate we are interested in is the
UIAccelerometerDelegate. It defines a single method, didAccelerate, that allows
us to receive acceleration-related data from the system (Apple Inc, 2008). It
became available in IPhone OS 2.0.
The UIAccelerometerDelegate starts a
secondary thread that fires the didAccelerate method at a rate that is set by
the user. For our purposes we fired the method 100 times per second. While in
the didAccelerate method it is possible to receive a float value that gives the
number of Gs (multiples of gravity) that the accelerometer is experiencing on
each of the three axis. Below is an example of a didAccelerate method that
demonstrates how one would read accelerometer values and output them to a
predefined set of labels.
-(void)accelerometer:(UIAccelerometer
*)accelerometer
didAccelerate:(UIAcceleration
*)acceleration {
����������� �labelX.text
= [NSString stringWithFormat:@"%@%f", @"X: ",
acceleration.x];
����������� �labelY.text
= [NSString stringWithFormat:@"%@%f", @"Y: ", acceleration.y];
����������� �labelZ.text
= [NSString stringWithFormat:@"%@%f", @"Z: ",
acceleration.z];
� }
����������� �
2.2 Accelerometer Filtering
����������� The
accelerometer in the IPhone produces much seismic noise. This is the biggest
problem that we have been faced with in the research. Even when sitting on a
perfectly still surface there is a baseline of noise received by the phone
which has a tendency to mask usable data. We have implemented different types
of filters with varying success. Figure 1 shows a plotting of activity during a
static period. There was no movement of any kind during this 25-second period.�
It is clear that there is some activity occurring to give the accelerometer
these constantly changing values. We are aiming to work through this noise to
come up with a valid threshold to raise an alarm.
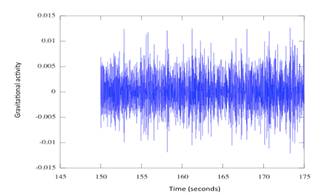
Figure
�1. Noise Example
2.2.1 Onboard Filtering
The
current smoothing technique used in the didAccelerate method is a standard
low-pass filter, taken from the IPhone Developers site. It removes the baseline
gravity and only measures the instantaneous changes in acceleration. This takes
all three values and sets their baseline to 0.
#define kFilteringFactor 0.1
accelX = acceleration.x - (
(acceleration.x * kFilteringFactor) + (accelX * (1.0 - kFilteringFactor)) );
�������������� This filtering allows us to combine the
three values making vibrations felt on two different axes to compound their
effect. The values are combined by taking the square root of the sum of the
squares of the three axis. When the three axes are combined this way, any
motion registered on either of the three axes will affect the result..
2.2.1 Off Device Filtering
����������� The
data that has been transferred off the device for use in more powerful
analytical languages is stored in the form of a text file and contains a timestamp,
accelerations in x, y, and z, and the sound decibel value. We have used Octave
and Matlab to perform analysis on the data.� Below is a sampling of how the
data was stored on the text file.
06/04/2010 10:30:50:26AM x:, 0.036224 ,y:,
-0.996170 ,z:, -0.108673 ,comb:, 0.812215 ,sound:, -53.422604
06/04/2010 10:30:50:29AM x:, 0.018112 ,y:,
-0.996170 ,z:, -0.108673 ,comb:, 0.730586 ,sound:, -54.087948
06/04/2010 10:30:50:30AM x:, 0.018112 ,y:,
-0.996170 ,z:, -0.108673 ,comb:, 0.657528 ,sound:, -54.087948
Once
we had the data transferred off the device we processed it using Octave. The
data was read into a matrix and run through a 4th order Butterworth
Filter with user-defined cutoff frequencies. The data is then plotted against
time and observed visually.� Figure 2 shows the results of filtered data of a
series of taps while the phone rested on a tabletop.
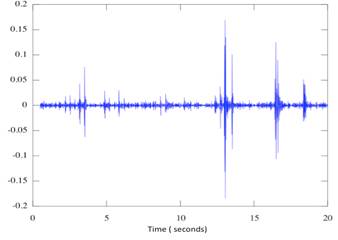
Figure 2. Example Graph
2.2.1.1 Kurtosis
����������� Kurtosis is the statistical measure of
the peakedness of the signature (Succi, Clapp, Gampert, & Prado, 2001). The
formula below is how these values are calculated. A group of samples is taken
spanning a period of time.
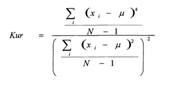
where xi is the current sample and μ
is the computed mean
over N samples;
�It is determined from the 4th
and 2nd moments of the signal peak. Kurtosis can be described as how
spiky the amplitudes are in the data; it is taken of a sample of time and
compared to a baseline.
If the kurtosis is significantly higher
then an alert can be raised. Instead of doing extensive baseline experiments
and storing baseline information we propose to compare the kurtosis of the
current period with a period 5 to 10 seconds prior. This will allow us to have
a running average kurtosis and if it spikes we will know to raise an alarm. In
Figure 3 a simple visual analysis of the data shows that in sample section1 the
kurtosis is clearly lower than in sample 2. This would demonstrate alert
conditions on the sensor.
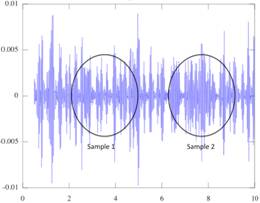
Figure
3. Kurtosis Example
3.0 Audio Processing
Analysis of vibration data can be
enhanced by similar analysis of sound passing through the air and recorded by
traditional microphones. Microphones pick up less of the natural
frequencies of the ground than vibration sensors, and generally record clear
impulses for footsteps and other percussive sounds of interest. Most of
these signals show a broad band of frequencies so frequency analysis is not
especially valuable. Time-domain analysis of the vibration signal can be
used to find audio peaks. Microphones do pick up more spurious signals
than vibration sensors due to many common forms of background noise such as
motors. However, a vibration peak that coincides with an audio peak tends
to be more likely to be meaningful than one that does not, and thus audio
provides confirmatory data for vibration analysis.
Sound processing operates on a similar
fashion as the accelerometer data. The IPhone microphone has a frequency
response from 20Hz to 20,000Hz. It supports a wide variety of audio formats.
Our tests stored the data in a .wav format. We are currently testing the
benefit of using different audio formats. The data is plotted in a similar way
as the seismic data. The data is the strength of the signal plotted against
time in milliseconds. The signal strength in decibels operates in a range from
-60 (quiet) to 0 (loud).� Below is a sample graph of an audio signal.
�Figure
4. Audio Plot Example
3.1 Objective C Audio
Recording
Our Objective C project must implement
the AVAudioRecorderDelegate to access the microphone (Apple Inc., 2009).� This
delegate implements methods to handle the recording such as managing thef
recording processing and managing errors.� When our program is run, the IPhone
starts a recording method where several settings are initalized such as the
sample rate and location of the stored recording. To process audio data we must
save the sound recording. We need to further test recording lengths to determe
the maximum amount of time we can record before running into memory and
hardware errors. We used a standard timer thread that fired a function 100
times per second. It was in this method that we wrote the sound values to the
same text file that the accelerometer data is stored.� The result is a single
text file that includes the three accelerometer values and the sound in
decibels. We can take this file off the IPhone for data processing using
stronger programs such as Matlab and Octave. When the suitable algorithms are
found, the sound processing will have to be done onboard the IPhone to provide
real-time alerts.
3.2 Audio Processing
Positive peaks of the energy detected by
a vibration sensor generally signal interesting phenomena.� To find them we
adapted techniques from our research on audio tracking (Rowe, Reed, &
Flores, 2010). We first subtract the signal from its mean value over the entire
recording interval to eliminate low-frequency components.� We then set to zero
all portions below a threshold set as a multiple of the standard deviation of
the signal; 1.5 times the standard deviation worked well in our experiments.�
The reason for ignoring negative portions of the signal is that footsteps and
other percussive sounds generally create a momentary increase of sound pressure
stronger than the subsequent negative peak, and thus is easier to detect.
We then look for peaks in the remaining
signal.� At a sampling rate of 100 hertz, typical footstep peaks will cover
3-20 samples and we did not find a need for further smoothing.� We currently
search for values that are the maximum in a centered window of seven samples,
and found this to be adequate coverage.� The time and height of each peak found
are calculated and stored, as well as peak narrowness (ratio of average height
before and after 0.045 seconds to the peak height), and asymmetry (ratio of the
difference of the heights 0.045 seconds before and after to the peak height).
For footsteps we exploit the observation
in (Sabatier & Ekimov, 2008) that normal footsteps of the same walker are
not less than 0.48 seconds apart and no more than 0.80 seconds apart.� We
search for sequences of peaks that obey this constraint.� We explored using the
narrowness and asymmetry to help with matching, but found they did not help
much because footsteps from the same pedestrian can vary significantly in
shape.�
The best clue to distinguishing footsteps
from background noise is in their periodicity.� Thus we search for groups of
two, three, and then four footsteps in sequence.� Since nearly all clear footsteps
will occur at least in groups of four, sounds that do not belong to such a
sequence are unlikely to be footsteps.� We rate members of sequences by the
evenness in time of the peaks in the sequence.� Sequences of footsteps at a
good distance from the microphone should also show only a single local maximum
of the peak heights at the time of closest approach.� But nearby footsteps may
show two maxima with typical sound-recording microphones with a narrow angle of
sensitivity (directionality), one for the closest approach and one for the
angle most along the axis of the microphone.� The IPhone audio microphone is
directional, but the vibrational sensors are not.
For excavation behavior we will also see
periodic peaks of 1 to 10 seconds, but they will be less regular.� Peaks should
be roughly the same width, so this gives us an additional clue.� We are also
starting to search for the human voice as it indicates conversations and is
usually a negative clue (a clue arguing against concealment and suspicious behavior).
4.0 Experiments
Original experiments were conducted
indoors at the Naval Postgraduate School Computer Science Lab.� The device
performed well on tabletops and floors. With these promising results, the tests
were taken outdoors. Our testing to date has been on hard packed dirt surfaces;
these will give us the best seismic wave transfer in an attempt to prove the
abilities of the phone. We took the testing to the back roads of the former Fort Ord. This made sure we were a great distance from any possible contamination. The
stand that was used was constructed from parts bought from the local hardware
store for less than four dollars. (Fig 1)
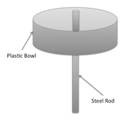 ��������������������
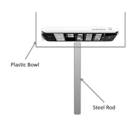
���� Figure 5. Stand
Example����������������������������� Figure 6. IPhone Placement
4.1 Process
The Phone was secured to the steel rod
inside the plastic bowl. The idea is that the seismic vibrations, that travel
in the top 6�-8� of the soil, will transfer to vibrations in the steel rod. The
rod will then vibrate the phone. The plastic bowl operates in the similar
fashion as a phonograph horn amplifying the vibrations. We experimented with
several different orientations of the phone. Our best results came when we laid
the phone face down and balanced on the rod as seen in Figure 6.� We used the
following procedure.
1.
Dig small hole to get the phone as
close to ground level as possible, about two to four inches deep. Geophones and
devices like ours become more effective the closer the device is to surface
level.�
2.
Place phone in stand and start the
application. Beginning the application, in our program, begins the process of
recording seismic and audio values at a rate of 100 times per second. While the
program is running, these values are stored in an NSMutableArray.
3.
Begin filming. All experiments
were filmed with video to have a visual record of the subject�s relation to the
phone at any given time. This can then be translated into actions that are
correlated with events in the data.
4.
Tap phone 5 times to create a
reference point in data to begin test.� A large audio and seismic event can be
linked to an action in the video to create an accurate events timeline.
5.
Run test with periods of walking
and periods of no movement. The periods of no movement were just as important
as the periods of activity. We used these periods to form the baseline of
events that we attempted to filter out.��
6.
Transfer data to a computer for
filtering and analysis.� We are currently doing this manually using the
Jailbroken IPhone application called NetATalk.
We also found it useful to
run two sensors in close proximity to each other. This allowed us to vary the
two sensors and look for more results. For example, we found that a phone in a
horizontal orientation gave better results than a phone with a vertical
orientation. We were also able to use a comparison of two signals to cancel out
ground noise. If the same spike is noticed at two different sensors, it is
unlikely that it is a human causing the alert. It is also our goal to
eventually use the strength of signal from two different sensors to give a more
accurate location of the event. In Figure 7 we would expect to see a stronger
event signal on Sensor 1 than Sensor 2. By comparing the two signals we would
be able to determine that the subject is passing between the two sensors but is
closer to Sensor 1. We could accurately track their direction based on this
data.�
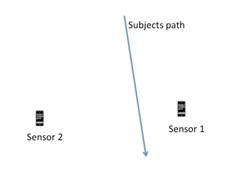
Figure 7. Dual Sensor Example
4.2 Results
In this section we discuss some tests we
conducted and show the seismic activity received by each test. Each graph will
represent the norm of the acceleration (combined X, Y, Z accelerometer values)
plotted on the Y axis of the graph with time in seconds plotted on the X axis.
We are looking for spikes in the data that show a strong vibration, or a wider
period of a weaker vibration that show other activities.
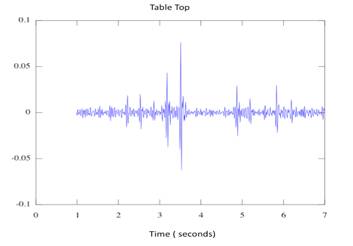
Figure
8. Table Top Results
Figure 8 depicts one of our first tests
where the phone was laid flat on a table and the table was tapped at a distance
of 5 feet from the phone. The two sets of five taps are clearly visible from
second 2 through 3.5 and 4.5 through 6.
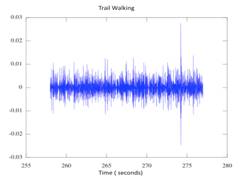
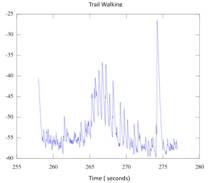
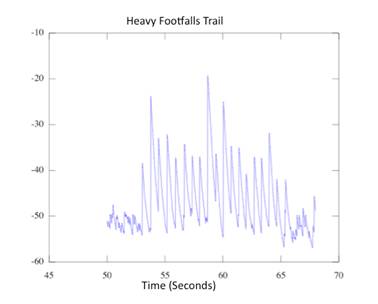
Figure 9. Trail Example
(Seismic)������������������������������� Figure 10. Trail Results (Audio)�����������������������������������������������������������������������������
Figure 9 represents a test that occurred
on a hard packed trail. The sensor was set up to the side of the trail and the
subject was a 200-pound man wearing boots. He walked down the trail passing
directly by the sensor around second 267. There are several peaks in the middle
of the time frame showing the approach of the subject. The peak at 274 was a
hammer strike near the sensor to mark the data. Figure 10 shows the processed
audio of the same test. The footsteps are clearly visible. The sound values are
stored as a running average of the surround second, this is why there is a hump
in the middle, it shows the approach and retreat of the test subject.
We also conducted some experiments of our
ability to detect digging. This would be useful to determine if an enemy is
attempting to dig under a fence or place an Improved Explosive Device (IED).
Digging produces a much higher seismic signal than simple walking, and a phone
should detect this action at a further distance. We were able to see some
activity when digging occurred within a few meters of the phone but will test
larger distances.
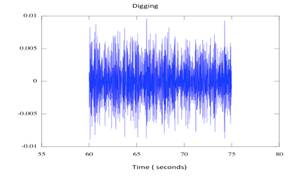
Figure
11. Digging Results
Figure 11 is of a seismic test where we
performed digging with a full-size shovel at a distance of 10 feet. The Figure
shows a 15-second interval where there were shovel strikes at 65 and 73
seconds. The graph and data did not reveal activity above the noise to the
level that we could provide an alert.
�
4.3 Future Tests
Future work will explore the effect of
ground types. We will obtain baseline seismic data that will be preloaded into
the application. The user will select the type of ground the sensors are placed
in and this will change the thresholds where we are looking for anomalies.
Harder packed dirt will likely carry a seismic signal longer so the threshold
can be set higher to decrease false positives. A sandy area will have very
little seismic wave traffic and the audio signal will be the main source of
alert detection.
4.4 Conclusion about Testing
The tests that we performed covered
situations from indoors to outdoors and from walking to digging. The seismic
signals that our IPhone captured were quite noisy. However, there were some
promising results. The phone clearly recognized footsteps indoors, and an
application could give alerts in that situation. Outdoor monitoring revealed a
smaller radius wherein the device would recognize an event. We believe the
noise in the device is masking the footsteps; close passes are recognized but
footsteps at a further distance disappear in the noise. Additional filtering
and improved hardware could provide better results.
5.0 Applications
Our vibration sensors have
a wide range of uses to the warfighter. Consider here some scenarios based on
fireteam and platoon-level offensive and defensive operations. Our current
calculations have used six meters as the detection radius for any given sensor.
Since we are attempting to use only smartphones and no external gear, we have
used Bluetooth that is built into the device to create an ad hoc network to
transfer the alerts to the base stations. Current smartphones do not provide
wireless hotspots on their own, so Wi-Fi was ruled out. Another concern we have
in our applications is the battery life. It would be impractical to place all
four devices out for the night, since this would drain their batteries and leave
the unit without their phones subsequently. Conversations with representatives
from Apple Inc. reveal that they are working on this problem. They are
developing portable chargers, including solar cells, to extend the length of
batteries to maximize military interests in the IPhone. Other smartphones have
replaceable batteries; this would be our suggestion for purchasing smartphones
for the US Military.
5.1 Offensive Operations
The sensors could be used in many
different offensive operations including ambushes and urban missions. In an
ambush, the sensor could be placed in the likely avenue of approach such as a
road or trail. The sensor would operate as a trigger to prepare the unit for
immediate action. The sensor works well at night and for a unit sitting a long
time in the ambush waiting for the ambush to develop. A sensor placed in the
avenue of approach would recognize movement giving the ambushing unit
significant notice. The few seconds could mean the difference between a
successful ambush with coordinated fire or an unsuccessful one where the ambush
is tripped early or late. The sensor will give an accurate location of the
enemy as they approach the area. Figure 12 shows an example on the left where
the enemy is expected to come from one direction. The diagram on the right
gives an example where the enemy�s location is not known and the phone will
pinpoint the direction the enemy is coming from.
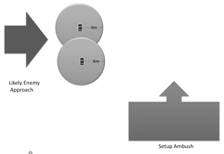
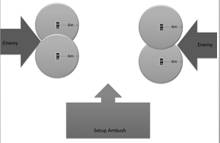
Figure 12. Ambush Examples
��������� ��������� �
5.2 Defensive Operations
We now discuss several
defensive configurations based on standard Marine Corps operating procedures. The
standard deployment of teams consists of the fireteam consisting of four
members. The members will keep five to twenty meters away from each other to
avoid multiple casualties from a single explosion. Fireteams generally consist
of a Team Leader, an Automatic Rifleman, an Assistant Automatic Rifleman, and a
Rifleman. The sensors would be deployed based on needs of the mission. For
instance, the left side of Figure 13 shows a deployment configuration where the
team wants to deploy all of their sensors with an auditory alarm.� The right
side of Figure 13 shows a situation when friendly lines are known and the team wants
to maximize the sensor coverage in a given direction. By deploying all four
sensors for a four-person team, the team is left without a base station, so all
alarms will have to be auditory. An auditory alarm will alert the enemy to the
sensor as well as the friendly team, but it may cause confusion among the enemy
while alerting the friendly team to the direction of the alarm.
Figure
13. Defensive Examples (Auditory Alarm)
If a team is deployed
behind enemy lines and is trying to maintain stealth, it may be beneficial to
deploy sensors with a silent alarm. The sensor array will be networked back to
a base station that is monitored by the team member on watch. A tripped alarm
will silently give an alert and rough direction to the watch giving him an
opportunity to assess the situation and determine if an attack is imminent or
can be avoided. This should give the team the few seconds of additional
warning.� Figure 14 shows deployment options for such a silent array.
�
Figure 14.
Defensive Examples (Silent Alarm)
The smartphone sensors can
also deployed to extend the effective range of the unit�s forward listening
post. When a platoon or company sets up a defensive position, the commander is
tasked with recognizing likely avenues of approach and deploying
listening/observation posts�� The listening post is usually a two-man team
placed as far as safely possible in front of friendly lines. They have a radio
to call back any activity to the friendly lines. At night this post has a
limited range.� The left side of Figure 15 displays a situation where the
sensors would be placed ahead of friendly lines to increase the effective range
of a Listening Post. The nightly post is sent ahead to give the main line a
pair of ears to warn the platoon of approaching enemy. The right side of Figure
15 shows how the sensors could be placed to cover areas that are hidden from a
unit�s line of sight.
Figure 15. Platoon Defensive Examples
5.3 Other Uses
The phones have also shown good detection
capabilities indoors.� This shows promise for the device to act as a makeshift
alarm system when operating in urban terrain. A team that takes up a security
position inside a building could use the phones in a number of different
configurations, such as placing a phone on floors to detect movement or near
entrances. The phone would be limited by the radio connection as Bluetooth does
not travel well through objects such as walls and floors.
Tripwires and other external sensors such
as motion detectors would be a way that a unit could improve the accuracy of
the device. A tripwire is a small wire attached to the phone on one end and a
stationary object on the other, and could amplify seismic effects and raise
alarms. We could again use silent or auditory alarms for the same reasons
discussed above.
6.0 Future Work
Processing of vibration and audio data
from a device should be done on the device for greatest efficiency.� Each
sentry device should make its own assessments on raising an alert. In the
Iphone we are using Objective C to write the applications, however, the Iphone
also ports the C language directly. Thus we are attempting to use Matlab to
perform calculations and we will use the abilities of Matlab to translate to C
to perform the same algorithm on the phone. The kurtosis readings will take
place at a set number of seconds to keep the processing down to a level where
it will not cause lag in the phone.
The determination of when to raise an
alert is key. We must run field tests in real environments to assess the
accuracy of the device. It will require us to make determinations on acceptable
levels of false positives and negatives. As we try to capture more distant
alerts, we risk getting more false positive alerts caused by ground and Iphone
noise.
We hope that as we improve our detection
algorithms to the point were we can attach a strength of alert value to an
alert received. If we could determine how strong an alert is, we could guess
how for away from a phone the seismic event is occurring. This would be useful
as subsequent alerts become higher or lower; then the base station would
interpret this as a threat moving toward or away from the sensor.
Tests should be done to determine how
multiple phones can interact with each other to give the base station a clearer
picture of where an alert is originating. The base station may be able to
register multiple alerts from multiple phones. These alerts would be processed
based on the strength of the alert and the occurrences of alerts and the phone
could be taught to determine a most likely location using triangulation.
Another concern with the current devices
on the market is the length of the battery. The IPhone is especially vulnerable
to this problem as there is no way to recharge it quickly.
7.0 Conclusions
We have discussed the use of a
smartphone as an unattended ground sensor. We have discovered that the
accelerometer inside the device is accurate enough to be used for military
applications. The microphone is an excellent complement to the accelerometer,
and a combination of both could provide a fairly accurate alert system for
small unit operations. But the data we obtained in experiments contained
considerable noise that is produced by the phone or accelerometer module inside
the phone. This noise is the biggest obstacle in the development of a
full-scale application to generate and pass on alerts to a base station.
Continued filtering techniques combined with further maturing of the smartphone
accelerometer technology could provide a cleaner signal and reduce the number
of false positives and provide an accurate and useful tool.
The testing we conducted provided good
results in controlled environments such as a tabletop and an indoor concrete
floor. Moving the device to an outdoor environment added more noise to the
signal while reducing the footprint signature, which made seismic footsteps
harder to detect. However, the microphone on the device provided some very
promising data that showed the approach and retreat of a test subject along
with individual footsteps.�
The capabilities of smartphones are
improving at a rapid pace. There are already phones in the market with 1GHz
processor. These phones will eliminate the need to transfer data to another
computer for processing. Also, significant amount of research is being done on
improving battery technology as well as on reducing the power consumption of
the phones. These would help make applications such as ours more practical on
phones.
8.0 References
Apple Inc. AVAudioRecorderDelegate
Protocol Reference. 17 Nov 2009. 31 May 2010 �< http:// developer.apple.com/iphone/library/documentation/AVFoundation/Reference/AVAudioRecorderDelegate_ProtocolReference/Reference/Reference.html
>.
Apple Inc. AVAudioRecorderDelegate
Protocol Reference. 17 Nov 2009. 31 May 2010
<http://developer.apple.com/iphone/library/documentation/AVFoundation/Reference/AVAudioRecorderDelegate_ProtocolReference/Reference/Reference.html>.
Pakhomov, A,
et al. "Single and Three Axis Geophone: Footstep Detection with Bearing
Estimation, Localization and Tracking." Proceedings of SPIE Vol. 5090.
Ardsley, NY: General Sensing Systems, 2003.
Pakhomov, A.
and T. Goldburt. "New Seismic Sensors for Footstep Detection and Other
Military Applications." Proc. of SPIE Vol. 5403. Bellingham, WA: General Sensing Systems LLC, 2004.
Rowe, N., A.
Reed and J. Flores. "Detecting suspicious motion with nonimaging
sensors." Proc. Third IEEE International Workshop on Bio and
Intelligent Computing. Perth, Australlia, 2010.
Sabatier, J.
and A Ekimov. "A review of human signatures in urban environments using
seismic and acoustic methods." Proc. IEEE Conf. on Technologies for
Homeland Security (2008): 215-220.
Succi,
George, et al. "Footstep detection and tracking." Proceedings of
SPIE 2493 (2001): 22-26.