Experiments with a Testbed
for Automated Defensive Deception Planning for Cyber-Attacks
Neil C. Rowe, Han C. Goh, Sze L. Lim, and Binh T. Duong
Cebrowski Institute, U.S. Naval Postgraduate School
Code CS/Rp, 833 Dyer Road, NPGS, Monterey CA 93943
ncrowe@nps.edu
Abstract: A key problem in research in cyberwarfare is the difficulty of conducting experiments with real attackers; science requires experiments, and it is desirable to make information warfare scientific where we can. Some data is available regarding attacks but not much on countermeasures. We report on a testbed we are developing for conducting defensive deception experiments with the normal random background of attacks on the Internet. The testbed is built on top of a honeypot, a computer system that deliberately invites attack to yield useful intelligence about attack methods, but modified to use various deception methods to fool an attacker. Unlike earlier attempts at deception testbeds, ours permits full interaction of an attacker with our system, and thus a wide range of deceptions is possible. We present data obtained by running a partial implementation of our testbed, showing patterns in attacks over time and with system modifications. We show analysis of situations in which attackers may have been induced to leave by thinking the system was not attackable or not in their interest to attack. We also discuss design directions we are exploring.
This paper appeared in the 2nd International Conference in I-Warfare and Security, Monterey CA, USA, March 2007.
Keywords: Deception, Internet, testbed, attack, honeypot, statistics
1. Introduction
Deception is common in cyberspace attacks (Hutchison & Warren, 2001), most often in the forms of identity deception, privilege escalation, Trojan horses (Chirillo, 2002), and various forms of social engineering. Defensive deception is used in honeypots, computer systems designed solely to collect information about attacks (The Honeynet Project, 2004). Honeypots need to be deceptive to fool attackers into thinking they are normal-use computer systems and thereby provide more data and more-useful data on their attack methods. However, honeypots generally only deceive attackers in a few limited ways: in the primary function of their systems (data collection on attacks), in surreptitious recording of attacker activity, and in concealing the presence of a protective firewall by techniques such as failing to decrement the time-to-live of packets passing through. These three are done for instance by the Sebek honeypot software (The Honeynet Project, 2004), a kind of defensive "rootkit".
Contrary to popular belief, deception is acceptable and important in a wide range of human activities, including law, business, entertainment, politics, and military activities (Ford, 1996; Whaley, 1982). Many deception tactics apply to cyberspace. (Rowe, 2006, ICIW) enumerates 23 methods for defensive deception in cyberspace derived from case grammar in linguistics. Deception could scare attackers away; it could slow attackers down, giving time to organize a defense; it could put imaginary obstacles in their way; it could fool attackers into thinking that they have succeeded in an attack when they have not; or it could fool attackers into revealing information about themselves. Previous work has developed theories for choosing good deceptions, both logical and decision-theoretic (Rowe, 2004), and has implemented some simple experiments such as deceptive Web sites. This can include rating of the effectiveness of the deception class in general (as for the semantic cases); rating the suitability of the resource or resources on which the deception is performed; and rating the method of presentation of the deceptive ploy. For instance, unavailability of a network connection is more likely than unavailability of a file system on a computer, so deception in the former would be more convincing than deception in the latter. Such analysis must also include ways for assessing the penalty of hurting legitimate users who might occasionally do something suspicious and get caught by our deceptions.
Too much information-warfare research involves broad claims for theoretical advantages of an approach without testing against real attacks. Theoretical security weaknesses do not always get exploited by attackers, and many attacks we do not yet understand occur on computer systems. So it is important for a discipline like information warfare to try to test against the real world, not just laboratory simplifications of threats. The work reported here is a modest step in this direction.
2. Previous work
Besides in honeypots, deception is being explored as a defensive tactic in cyberspace by several projects. The Deception Toolkit (Cohen, 1999) is the first important example, a system that faked the first steps of key protocols for a number of virtual machines, in the hopes of tying up an attacker in fruitless attacks on nonexistent machines. Such tactics are forms of deceptive mimicry, and can be effective because many attacks are highly specific to operating-system versions. This work was extended to "attack graphs" that permitted some simple game-playing with the attacker as to which machines and services to fake based on what an attacker had done so far (Cohen and Koike, 2003). Other pioneering work was that of (Gerwehr et al, 2000) that created fake intelligence information for spies to find.
Recent related work that has proposed deceptive methods for defense of computer systems includes (Vrable et al, 2005) that built whole deceptive networks called "honeypot farms". (Nazario, 2004) proposed methods for fooling worms into avoiding sites by mimicking their messages for already-infected sites. Several tools such as Morph (www.synacklabs.com/projects/morph) can modify outgoing packets to make a machine appear to have a different operating system or version than the one it really has; this is a good way to fool common reconnaissance tools such as NMAP. (Rowe, 2006, HICSS) proposed deception methods for creating convincing-looking fake file directories. An interesting recent development has been the appearance of tools for attackers to detect honeypots. (Holz & Raynal, 2005) suggested a range of specific clues in the operating system that attackers could use, many of which could be faked to defend a computer system. Other methods for defeating honeypots and responses to them are mentioned in (Krawetz, 2004) and (McCarty, 2003).
Developing good deception techniques benefits from good data on attack patterns. Various attack-record datasets are available for testing defenses such as the TGS data from Skaion, but they generally provide only historical data that does not cover recent trends in a fast-changing environment. The DETER testbed developed by the National Science Foundation can be used to test malicious code experimentally, but exploits are generally tested one at a time with it and this does not much capture the dynamics of real Internet attacks. Using DETER also requires bureaucracy: A test must be submitted for approval in advance, checked for safety, and then time must be allocated on the testbed. This makes it hard to test new exploits quickly or respond quickly to Internet trends. And of course, new attacks need not bear any similarity to previous attacks.
Thus it seems important to analyze live attacks and countermeasures on a real machine. We made a start recently by implementing a honeypot network ("honeynet") with some additional features (Rowe, Duong, and Custy, 2006). We stationed a honeynet on the Internet unimpeded by any firewall, with the goal of manipulating it in a variety of ways to deceive attackers. The honeynet mainly collects a wide variety of common speculative attacks on the Internet, what has been termed the "background radiation" of the Internet (Pang et al, 2004). We discuss here the data we have since obtained about it and the first deceptions we have tried with it.
3. Testbed and data-collection setup
3.1 Honeypot network design
We used three machines running Linux: a router, a honeynet, and a data collector. The honeynet itself simulated two virtual machines using the VMWare Workstation product, a regular Windows machine and a Windows Web server. The router was connected to a digital subscriber data line that did not go through our school's firewall. The purpose of the router was to host an intrusion-detection system, Snort, that would not be affected directly by exploits on the victim machine. The reason for the data collector was to provide secure archival data. All machines were kept current with automatic updates for Linux and Windows. Intrusion-detection rules were also updated periodically from our school's Snort-rule collection.
3.2 Summary data collection
We collected data from Snort for our honeypot network for 41 weeks from January 22 to November 7 2006. In this period, Snort raised 175,516 alerts, including a few on traffic intended for neighboring systems. Internet traffic is quite bursty, but by clustering on alerts of the same class and alert message that occurred within 10 minutes of one another, we got much less bursty data that looks much more like a Poisson distribution over time. Thus we preferred the clustered data for analysis, and a 10-minute clustering window appeared the most useful. Clustering on remote IP address gave similar results (around 2/3 of the successive-line pairs involved the same IP addresses) but not quite as good.
Analysis is clearer it we remove the effect of day of the week. Figure 1 shows the number of alerts in the first 39 weeks as a function of day of the week, clustered in two ways. The first way was the time clustering described above; the second was by finding sequences of alerts from the same external IP address in the same 10-second time window, and counting each such sequence as a cluster, a simplified versions of the ideas of (Julisch, 2003). An example two-alert sequence that was common was a string of NOPs followed by a buffer overflow attempt. (Alert sequences occurring less than four times in the sample were split in two if the subsequences occurred at least once, since we guessed that such sequences were coincidental concatenations.) Figure 1 suggests that many attackers think of their work as a Monday-to-Thursday job.
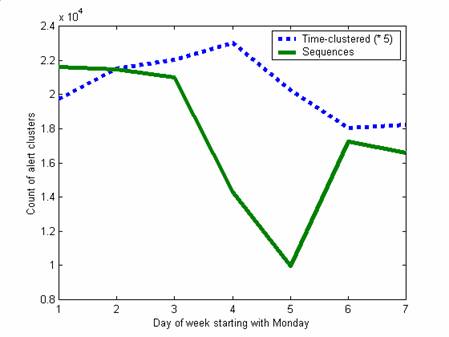
Figure 1: Alert counts as a function of data of the week for the first 39 weeks.
3.3 Trends per week
Figure 2 shows the alert counts per week over the first 41 weeks as clustered three ways, and Figure 3 shows the counts of the six major alert categories clustered only by time. The honeypot network was not working in weeks 8-12 and for several days in weeks 25, 26, and 37 (as discussed in the next section). Clustering was done of alerts using the two methods described above plus by using the K-Means algorithm. The latter clustered events having similarities on 12 boolean metrics including date, IP addresses, port numbers, and alert type; the clustering threshold was adjusted so that we obtained a mean of 306.4 and a geometric mean of 71.3 clusters per day.
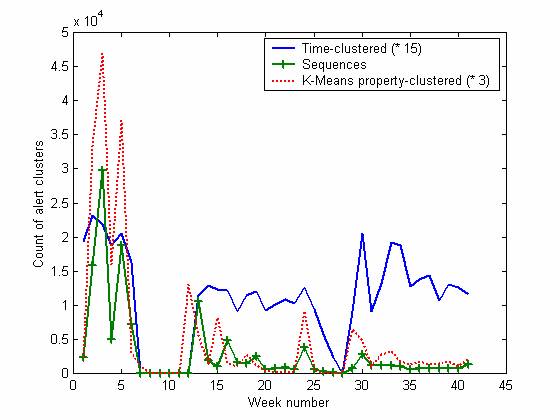
Figure 2: Alert counts per week for the first 41 weeks of alerts, clustered by time (times 15), by sequences, and by K-Means clusters on boolean properties (times 3).
We can see that most kinds of attacks decreased significantly over time. We infer that attackers did initial reconnaissance to detect vulnerabilities (as often in BAD-TRAFFIC attacks, which either work or don't), and then mostly ignored us when they saw we were not an easy target. In this time period, the system only crashed once from attack, and we saw little evidence of permanent changes to the operating system. The BAD-TRAFFIC, NETBIOS, and SHELLCODE alerts (and to a lesser extent, MS-SQL) decreased significantly over time independent of the offline periods, and resulted in an over downward trend with a linear fit of losing 3.53 alerts per week. Apparently attackers do not return to a system often once they have decided it is not interesting. This suggests that an effective way to obtain reduced attacks is to use existing IP addresses for new systems; deception works well when your adversary underestimates your ploys (Vrij, 2000).
The decreasing trend in attack traffic was not shared by the Internet in general in the 41 weeks, but there were moderate similarities in traffic patterns on shorter time scales. This we confirmed when we obtained data for Snort alerts for our school's network for the time period from August 10 through September 22 (roughly weeks 29 through 35). The mean number of alerts per day was 1351.6 and decreased 30.5 per day; in the same time period, the honeypot saw a mean of 136.6 alerts per day and decreased by 1.952 per day, a comparable rate.
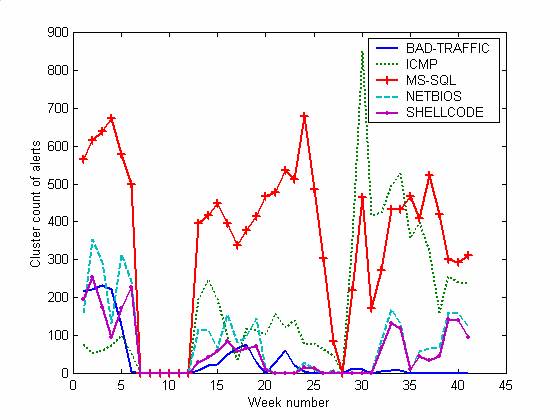
Figure 3: Alert cluster counts per week of the major categories.
We used the Durbin-Watson test to examine the autocorrelation (Bowerman, O'Connell, and Koehler, 2005) of the count of alerts on the honeypot. We first fit the data to a linear trend and extracted its residuals. Autocorrelation of the residuals for the weekly data (31 weeks, excluding the weeks with days in which the honeypot was turned off) was significant at a lag of 1 week (0.983) but not beyond that. Consistent with this, autocorrelation of the daily data (215 days) was only significant to a 99% level at lags less than a week: 1 day (0.555), 2 days (0.898), 3 days (1.152), 4 days (1.227), 5 days, (1.276), and 6 days (1.489). This suggests definite multiweek similarities, probably due to attack "fads" or repeated attacks of the same type by the same users. As for the five largest categories of alerts, autocorrelations for one-week lags were 0.384 for BAD-TRAFFIC, 0.980 for ICMP, 1.068 for MS-SQL, 0.977 for NETBIOS, and 0.815 for SHELLCODE. So BAD-TRAFFIC was the most faddish. As the graphs suggest, we did not see much "scale-free" behavior as has been seen on the Internet in other work: Attacks in a broader time window were more regular than in a smaller time window, not the same.
3.4 Effects of system manipulations
The down time of the honeypots clearly did affect the attackers. ICMP alerts increased both times in the time-clustered data after the system had been offline for several days, both at week 8 and at week 28. Note that the variety of alert sequences decreased steadily, so it was the number of attacks of the same type that increased at both week 8 and week 28. This suggests automated reconnaissance that needs to keep in frequent contact with our honeypot, perhaps increasing the priority of contacting us when it has had repeated failures. Another explanation is a Trojan horse bot on our honeynet, but we saw no evidence when comparing checksums over time that our honeypot had been compromised in this way. This suggests that deliberately taking a system offline is a good way to encourage reconnaissance traffic, and higher rates of traffic should yield clearer data trends. Only a small amount of this traffic, by the way, was classic ECHOs; most of it was more sophisticated.
There were differences in the outages. Weeks 8-12 just involved disconnecting the Internet hardware connection without changing any software. Thus the reduced level of non-ICMP attacks likely represents attackers "losing interest" in a site that is no longer working. But in weeks 27 and 28, crashes of the system were due to our own mistakes worsened by configuration problems. We then reinstalled the operating system of the honeypot. We had been patching the operating system with the latest Microsoft updates in the meantime, but even so, a fresh operating system seemed to trigger a higher rate (though not variety) of attacks. Finally, in weeks 39-41 we reinstalled the operating system and virtual machines, excluded a small amount of non-honeynet traffic from calculations, and added new software to the honeypot that suggested monitoring (TCPDump). MS-SQL and ICMP alerts decreased but BAD-TRAFFIC and SHELLCODE alerts increased. We recently conducted experiments where we deliberately dropped (ignored) ICMP packets for a week, but saw no significant effect on attacks, so either we need to do experiments over a longer period to see effects or attackers look for more substantial clues than dropped packets. We will explore this further.
More differences in the response of the attackers to changing circumstances can be seen on other metrics. Figure 4 shows the histogram of interarrival times for successive alerts over all 41 weeks and Figure 5 shows it for October 19 through November 7. Several important peaks are different in the data over the shorter period despite reasonable sample sizes (175,000 and 6,200). The peak at 3.7 (representing 0.04 sec.) is higher, the peak at 8.6 (representing 7 sec.) is lower, and the peak at 18.3 (representing one day) has disappeared. (The peak at 6.9 represents 1 second exactly, and is important in both graphs – apparently there are a lot of programmed one-second delays.) Differences could be due to changes in the honeynet in the last period. Since the peaks suggest automated attack timings, differences in them suggest that automated attacks are responding differently to the honeynet changes. In general, occurrences of common time gaps are good clues to an automated attack, and facilitate identification of more-interesting manual attacks. Note there was very little evidence of attack plans requiring more than a minute, despite the worries of some researchers about "low and slow" attacks.
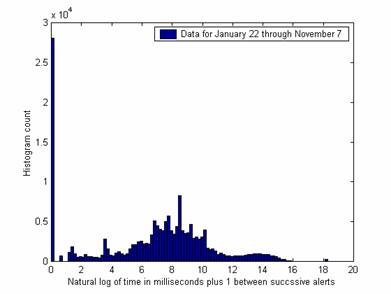
Figure 4: Histogram of interarrival times between alerts over 41 weeks.
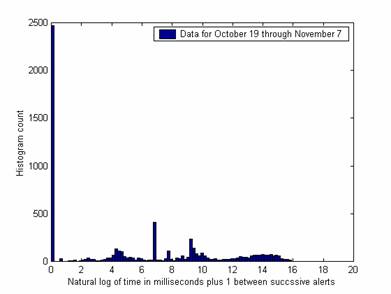
Figure 5: Histogram of interarrival times for alerts over three weeks of system changes.
Differences in the external IP addresses used in attacks are also seen over time. Figures 6 and 7 compare the first byte of the IP address over two successive periods of three weeks before and after we made deliberate changes. 63 is the first byte of our own address and so makes a big peak in both time periods. But a new larger peak occurs at 67 and a new smaller peak at 210. These probably indicate responses to changes in the honeynet as we did not see these peaks in the previous 35 weeks.
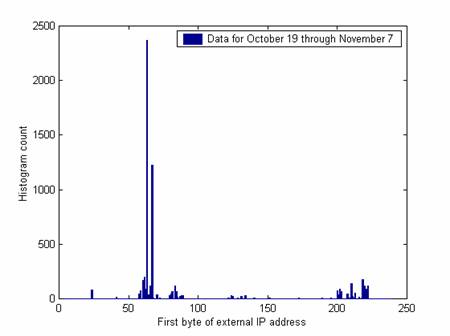
Figure 6: Histogram of IP addresses used in attacks, October 19 through November 7.
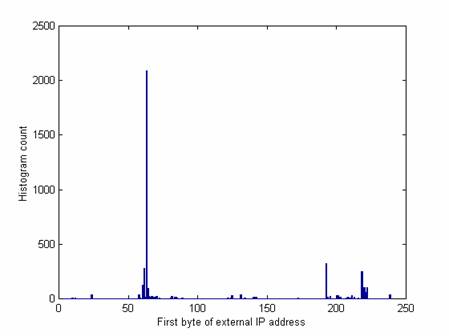
Figure 7: Histogram of IP addresses used in attacks, September 29 through October 19.
4. Learning to scare attackers away
Currently we are developing methods for automatically learning good deceptions to induce attackers to go away. The method is to observe behavior of attackers and record the last few things they did before they went away, then use concept learning to generalize these circumstances into countermeasures we can implement, perhaps eventually automatically within seconds. Methods for automatically learning patterns in intrusion data have been studied previously (Qin & Hwang, 2004; Wuu & Chen, 2003) but they have been focused on finding new intrusion-detection patterns rather than new countermeasures.
Our rationale for this approach is that at some point in interacting with out honeynet, attackers have decided either it is not worth attacking or they personally are unable to attack it. Attackers may be persuaded to reach either of these conclusions, both equally useful to us, by deception. If we can see what features of the honeypot they were examining just before they gave up, those features could be useful features to put on other machines or make more obvious for the attacker on this machine. For instance, most attackers want to avoid honeypots, so they could be finding features suggestive of honeypots just before they log out; if this is the case, we could add more features of honeypots to encourage them to log out sooner. Such deceptive ploys could act as a "vaccination" of a computer system, reducing the severity and likelihood of success of an attack.
4.1 Experiments
To guide our selection of "scaring" tactics, we extracted from Snort the last alert generated each day for each source IP address appearing in some alert that day. We took counts over these alerts over 39 weeks and compared them to the total observed counts of the alerts. This ratio represents a conditional probability of the alert being last in the sessions for the day for that IP address. Our hypothesis is that alerts with high conditional probabilities are more likely to represent "scaring-away" phenomena. The top-rated alerts are shown in Table 1 (with their conditional probability of being last, the associated count ratio, the Snort alert category, and the description of the alert).
Table 1: The top-rated session-ending alerts, with their conditional probabilities and counts of occurring last in a session.
|
Prob. |
Count ratio |
Alert type |
Alert message |
|
1.0 |
3/3 |
WEB-MISC |
Cisco IOS HTTP configuration attempt |
|
1.0 |
3/3 |
POLICY |
FTP 'MKD / ' possible warez site |
|
1.0 |
1/1 |
SHELLCODE |
x86 setgid 0 |
|
1.0 |
1/1 |
NETBIOS |
DCERPC Messenger Service buffer overflow attempt |
|
1.0 |
1/1 |
BACKDOOR |
netthief runtime detection |
|
0.769 |
10/13 |
ICMP |
traceroute |
|
0.722 |
13/18 |
SCAN |
FIN |
|
0.667 |
2/3 |
BAD-TRAFFIC |
tcp port 0 traffic |
|
0.625 |
35/56 |
POLICY |
SMTP relaying denied |
|
0.625 |
10/16 |
WEB-MISC |
robots.txt access |
|
0.5 |
1/2 |
WEB-MISC |
net attempt |
|
0.5 |
1/2 |
WEB-CGI |
printenv access |
|
0.5 |
1/2 |
WEB-CGI |
icat access |
|
0.5 |
1/2 |
ICMP |
Destination Unreachable Network Unreachable |
|
0.5 |
1/2 |
DNS |
named version attempt |
|
0.488 |
699/1431 |
ICMP |
Destination Unreachable Port Unreachable |
|
0.433 |
13/30 |
POLICY |
FTP anonymous login attempt |
|
0.425 |
37/87 |
INFO |
web bug 1x1 gif attempt |
|
0.4 |
2/5 |
WEB-CGI |
wrap access |
|
0.359 |
110/306 |
ICMP |
Time-To-Live Exceeded in Transit |
|
0.354 |
17/48 |
INFO |
web bug 0x0 gif attempt |
|
0.333 |
3/9 |
WEB-CGI |
calendar access |
|
0.333 |
1/3 |
WEB-FRONTPAGE |
/_vti_bin/ access |
|
0.333 |
1/3 |
NETBIOS |
SMB-DS srvsvc NetrPathCanonicalize WriteAndX little endian overflow attempt |
|
0.333 |
1/3 |
EXPLOIT |
WINS name query overflow attempt TCP |
|
0.275 |
11/40 |
NETBIOS |
SMB-DS umpnpmgr PNP_QueryResConfList unicode little endian attempt |
|
0.273 |
6/22 |
WEB-MISC |
weblogic/tomcat .jsp view source attempt |
|
0.219 |
1562/7133 |
BAD-TRAFFIC |
udp port 0 traffic |
|
0.216 |
187/867 |
NETBIOS |
DCERPC ISystemActivator path overflow attempt little endian unicode |
|
0.200 |
1130/5646 |
MS-SQL |
version overflow attempt |
Some of these counts are based on just a few instances and thus may be misleading, although rare events with strong conditional probabilities still can indicate attacks by experts. But some interesting strong conditional probabilities are supported by significant evidence like that for "ICMP traceroute" representing apparently failed attempts at using classic network reconnaissance tools. Several explanations are possible for the strong conditional probabilities:
- That these alerts are generated by popular attack tools and just happen to be the last alerts generated by use of those tools in many instances. However, many attackers jealously guard their attack tools and do not like to share.
- That the alerts represent logically necessary last steps in common multistep attacks. This can occur if they are the "payoff" steps that accomplish important attack goals. However, most of the Table 1 alerts cannot be so construed.
- The alerts represent that last thing seen after the attacker seized control of our honeypot and turned off Snort. However, we saw no evidence of that from our integrity checker.
- That the alerts represent things that an attacker did that convinced them that a machine was not worth attacking.
If the last is the case, a "vaccination" might mean applying up-to-date patches of the operating system to prevent an exploit from succeeding (as for ICMP traceroute and SCAN FIN events). But in other cases this data guides us to do specific things to the operating system that we may not have thought about otherwise (such as turning off SMTP relaying and robots.txt access). And instead of doing those things, which may require work to implement, it may be sufficient to deceive about them – just respond to the specific way the attacker is querying them, and give a false response.
Alerts are only the "tip of the iceberg" in malicious user behavior. So our current work is using the TCPDump network-packet extractor to obtain packets destined for our honeypot, and then studying the last packet involving each external IP address each day. Such "last packets" comprised a small fraction, 88 for four weeks versus 100,000 total packets per day. We have seen clear correlations in the size of the last packet with the type of attack, more so than with packets in general; for instance, last packets of size 922 were strong indicators of a particular Trojan horse spread through email. We have seen interesting differences in the TCP flags set in last packets (Table 2). As could be expected, we saw many RST (reset) flags and no flags indicated forthcoming packets. The hope of this approach is to use distinctive features of last packets to design quite specific deceptions, perhaps automatically in response to new threats.
Table 2: Flag-pattern statistics on the last packets seen from an external IP address.
|
Packet flag pattern |
Count in one day in all packets received |
Count in 4 weeks in last packets |
|
TCP/ACK |
126 |
12 |
|
TCP/ACK-DON'T FRAG |
141 |
0 |
|
TCP/ACK-PSH |
115 |
0 |
|
TCP/ACK-PSH-DON'T FRAG |
1440 |
0 |
|
TCP/ACK-PSH-FIN |
4 |
0 |
|
TCP/ACK-RST |
7 |
15 |
|
TCP/ACK-SYN |
36 |
0 |
|
TCP/ACK-SYN-DON'T FRAG |
88 |
0 |
|
TCP/ACK-FIN |
2 |
0 |
|
TCP/ACK-FIN-DON'T FRAG |
180 |
0 |
|
TCP/PSH-SYN-DON'T FRAG |
2 |
0 |
|
TCP/SYN-DON'T FRAG |
88 |
0 |
|
TCP/RST |
0 |
2 |
|
UDP |
2382 |
59 |
|
UDP/DON'T-FRAG |
13 |
0 |
5. Conclusions
This is a difficult area in which to do research because attackers are not especially systematic. Several useful conclusions are still possible with even these preliminary results.
- Attacks are fewer on Friday, Saturday, and Sunday. That suggests those days are good times to bring up a new system.
- Attacks on a newly used IP address are high at first and then decrease significantly over a few months. This suggests that a good way to reduce attacks on a new computer is to reuse an existing IP address if you can.
- A few common vulnerabilities are repeatedly attacked. It is good to have up-to-date patches on these (www.cert.org often provides good warnings), or at least good fake indicators of the patches. Then many common attacks will simply terminate when they see evidence of patches installed. Note that while we may be more vulnerable to rarer attacks, reducing the traffic of common attacks can make it easier to handle the rarer ones.
- Taking a system offline increases alerts due to ICMP traffic, packets used for network-management communications. Fortunately, there are not many ICMP vulnerabilities and most are straightforward to fix. Thus taking a system offline irregularly may encourage attackers to waste more time fruitlessly attacking an impervious machine instead of searching for a more susceptible target.
- Many of the commonly attacked vulnerabilities refer to features of the configuration of a site, its parameters and services, like SMTP relaying. The last-alert data provides good clues to how to set these parameters to discourage interest by attackers, by setting them to uninteresting values or turning off the services interesting to attackers.
- The last packet received from a particular IP address shows a limited range of flags, and it may be possible to exploit this in defensive deception.
In future work we will test the effect of more elaborate types of deceptions on attackers with Snort-Inline, an intrusion-prevention system variant on the Snort intrusion-detection. We will test in particular the effects of changing suspicious packets since lack of an expected response was a major prod to attackers in the work reported here.
6. Acknowledgements
This work was supported by the U.S. National Science Foundation under the Cyber Trust Program. The views expressed are those of the author and do not represent policy of the U.S. Government.
7. References
Bowerman, B., O'Connell, R, & Koehler, A. (2005) Forecasting, time series, & regression: an applied approach, 4th ed., Belmont, CA: Thomson Brooks/Cole.
Chirillo, J. (2002) Hack attacks revealed. New York: Wiley.
Cohen, F., and Koike, D. (2003) "Leading attackers through attack graphs with deceptions," Computers and Security, Vol. 22, no. 5, pp. 402-411.
Ford, C. V. (1996) Lies! Lies!! Lies!!! The Psychology of Deceit, Washington, DC: American Psychiatric Press.
Gerwehr, S., Weissler, R., Medby, J. J., Anderson, R. H., & Rothenberg, J. (2000, November) "Employing deception in information systems to thwart adversary reconnaissance-phase activities," Project Memorandum, National Defense Research Institute, Rand Corp., PM-1124-NSA.
Holz, T., and Raynal, F. (2005, June) "Detecting honeypots and other suspicious environments," Proc. 6th SMC Information Assurance Workshop, West Point, NY, pp. 29-36.
The Honeynet Project (2004) Know Your Enemy, 2nd Ed., Boston: Addison-Wesley.
Hutchinson, W., and Warren, M. (2001) Information warfare: corporate attack and defense in a digital world, London: Butterworth-Heinemann.
Julisch, K. (2003, November) "Clustering intrusion detection alarms to support root cause analysis," ACM Transactions on Information and Systems Security, 6 (4), pp. 443-471.
Krawetz, N. (2004, January-February) "Anti-honeypot technology," IEEE Security and Privacy, Vol. 2, No. 1, pp. 76-79.
McCarty, B. (2003, November-December) "The honeynet arms race," IEEE Security and Privacy, 1(6), pp. 79-82.
Nazario, J. (2004) Defense and detection strategies against Internet worms, Boston, MA: Artech.
Pang, R. Veqneswaran, V., Barford, P., Paxson, V., and Peterson, L. (2004) "Characteristics of Internet background radiation," Proc. 4th ACM SIGCOMM Conference on Internet Measurement, Taormina, IT, pp. 27-40.
Qin, M., & Hwang, K. (2004) "Frequent episode rules for Internet anomaly detection," Proc. 3rd IEEE Symposium on Network Computing and Applications, Los Angeles, CA, pp. 161-168.
Rowe, N. (2004, December) "Designing good deceptions in defense of information systems," Proc. Computer Security Applications Conference, Tucson, AZ, pp. 418-427.
Rowe, N. (2006, January) "Measuring the effectiveness of honeypot counter-counterdeception," Proc. 39th Hawaii International Conference on Systems Sciences, Poipu, HI.
Rowe, N. (2006, March) "A taxonomy of deception in cyberspace," Proc. International Conference on Information Warfare and Security, Princess Anne, MD, pp. 173-181.
Rowe, N., Duong, B., and Custy, E. (2006, June) "Fake honeypots: a defensive tactic for cyberspace," Proc. 7th IEEE Workshop on Information Assurance, West Point, NY, pp. 223-230.
Tirenin, W., and Faatz, D. (1999, October) "A concept for strategic cyber defense," Proc. Conf. on Military Communications, Atlantic City, NJ, Vol. 1, pp. 458-463.
Vrable, M., Ma, J. Chen, J., Moore, D., Vadekieft, E., Snoeren, A., Voelker, G., and Savage, S. (2005) "Scalability, fidelity, and containment in the Potemkin Virtual Honeyfarm," Proc. ACM Symposium on Operating Systems Principles, Brighton UK, pp. 148-162.
Vrij, A. (2000) Detecting lies and deceit: the psychology of lying and the implications for professional practice, Chichester, UK: Wiley.
Whaley, B. (1982, March) "Towards a general theory of deception," Journal of Strategic Studies, Vol. 5, No. 1, pp. 179-193.
Wuu, L.-C., & Chen, S.-F. (2003, October) "Building intrusion pattern miner for Snort network intrusion detection system," Proc. 37th IEEE Canadian Conference on Security Technology, pp. 477-484.