14th ICCRTS: C2 and Agility
Automated Instantaneous Performance Assessment for Marine-Squad Urban-Terrain Training
Topic 8: C2 Assessment Tools and Metrics
Neil C. Rowe
Naval Postgraduate School
Code CS/Rp, 1411 Cunningham Road, Monterey CA 93943 USA
ncrowe@nps.edu, (831) 656-2462
Abstract
Urban operations (MOUT) are a key component of U.S. Marine training, yet assessment of performance during the later and more integrative training exercises is difficult because events happen quickly and walls impede full view.� We are building a performance assessment system called BASE-IT that will collect data on positions, orientations, postures, and activities of Marines during training using a network of cameras.� BASE-IT will automatically summarize performance over exercises and flag problematic behaviors for after-action review by commanders.� It will then provide a virtual-reality display showing not only what happened but alternative courses of action using capabilities similar to those of video games.� The work reported here focuses on measures of performance assessment for each instant of time ("instantaneous measures").� From reading of Marine documents and discussions with subject-matter experts, we identified 30 potential instantaneous performance measures for a group of Marines, and selected thirteen for implementation: dispersion between Marines, collinearity of Marines, number of clusters of Marines, number of interactions with non-Marines, danger, situational awareness measured as view coverage, path safety, relative mobility, speed of the group of Marines, safety of weapons orientation, coverage with weapons, surrounding of search targets, and contact with the leader.� These measures have interesting locality properties in space and time.� We show results of automated analysis of images of training at the Twenty-Nine Palms Marine base.
This paper appeared in the Proceedings of the 14th International Command and Control Research and Technology Symposium, Washington, DC, June 2009.
Introduction
We want to aid urban-warfare training for the U.S. Marines.� Marine doctrine specifies that units in hostile or potentially hostile terrain maximize their dispersion within the limits of good communication, maximize their situation awareness or visual coverage of the area, and minimize the possible damage by adversaries (USMC, 1998; USMC, 2005).� For example:
�Platoon sized formation - squads generally travel in the same manner as the teams in a squad sized formation - along parallel routes. The intent is to create less of a target to the enemy but yet still allow the patrol to quickly react to an incident. Individuals within the units/teams move in a tactical stagger formation.�� (USMC, 2008)
We would like to quantify these factors with the goal of automating their calculation from video of training exercises, particularly during the last and most comprehensive exercises before deployment.� People learn better when they get immediate or near-immediate feedback (Kluger and DeNisis, 1996), particularly in learning spatio-temporal skills as these are.� Performance measure calculated in real time could be downloaded to handheld devices used by instructors, giving them immediate feedback about dangerous conditions or violations of doctrine.� Performance can also be aggregated automatically for summaries of performance for each squad-exercise pair, for each exercise, for each squad, or for each type of activity, aiding after-action review (Hixson, 1995) and analysis of trends.
We are developing these capabilities as part of the BASE-IT project, a collaboration between the MOVES Institute at the Naval Postgraduate School, the University of North Carolina, and Sarnoff Laboratories.� Figure 1 shows the overall design of the BASE-IT system.� Performance evaluation is in upper middle and interacts with a database of tracking information provided by the data capture system.� Tracking information consists of timestamps, positions of Marines obtained from multiple cameras and wearable GPS receivers, orientations of the Marines, and orientations of their weapons.� Performance analysis also exploit "behavior analysis" which identifies broad categories of what the Marines are doing, such as waiting, being on patrol, surrounding a building, manning a checkpoint, or searching for an improvised explosive device.� Averages, extremes, and counts of high and low values of performance measures over an exercise are computed and abnormal values are flagged.
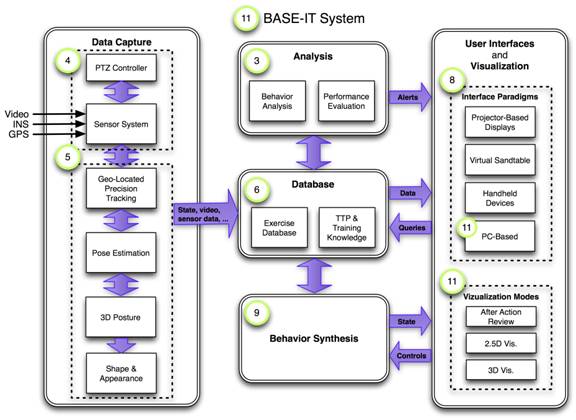
Figure 1: BASE-IT system overall design.
Our performance assessment is based on Marine doctrine.� Documents such as (U.S. Marines Corps, 1998; 2005; 2008) provide a start but there is important unwritten knowledge that requires the guidance of subject-matter experts and feedback from them concerning prototypes.
The U.S. Army has similar training needs, and has their own technology for semi-automated performance assessment (Hixson, 1995).� It is used at the National Training Center at Fort Irwin and covers a wide range of training needs.� Like BASE-IT, multimedia is provided both for After-Action Reviews and later analysis in Take Home Packages.� Video is the main product of the assessment technology, and no sophisticated analysis is done of the type we propose here, though interesting experiments have been done (Blankenbeckler et al, 2008), some automated analysis of speech communications has been tried (LaVoie et al, 2008), and assessment of behavior in virtual worlds has been related to assessment in real-world exercises (Gately et al, 2005).
Performance measures and assumptions
The BASE-IT project addresses outdoor training only.� We
assume a mostly two-dimensional world for which we have a detailed terrain
model (including buildings) in advance.� We analyze small groups of 5-20
Marines in a fire team or squad.� We assume that cameras and GPS receivers
permit tracking of Marine positions within at least a meter, and calculation of
their head and weapon orientations within 45 degrees.� Hence each Marine at a
timestamp can be defined by a quadruple ![]() and let the number of Marines be N.�
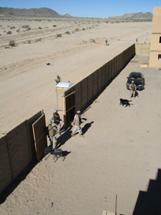
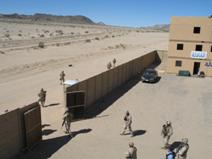
Our initial experiments analyzed pictures of training exercises like Figure 2.�
It shows Marines on patrol during training at the Twenty Nine Palms base,
heading for the brown building in the top middle.
and let the number of Marines be N.�
Our initial experiments analyzed pictures of training exercises like Figure 2.�
It shows Marines on patrol during training at the Twenty Nine Palms base,
heading for the brown building in the top middle.
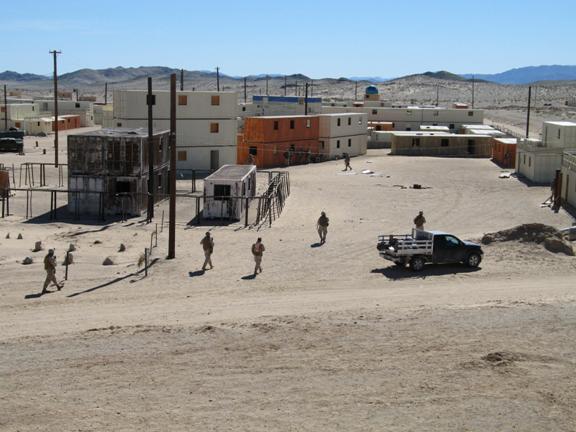
Figure 2: Example image of Marine urban-operations training.
After reading documents detailing Marine doctrine and policies, and discussions with experts familiar with Marine training, we identified the following measures as the most important in assessing the performance of a Marine unit at any instant, what we call "instantaneous" measures:
- Dispersion: Marines should maintain a minimum distance from one another.
- Collinearity: Marines should avoid forming a single line.
- Clustering: Marines should avoid clustering too closely.
- Role players: Marine should interact with role players that are present.
- Danger: Marines should minimize time in dangerous areas.
- Situation awareness: Marine units should keep all directions in view.
- Path safety: Marines should follow paths that minimize danger.� We later decided this measure was redundant with the danger measure since it mostly represents the aggregation of its inverse along a path, but it does provide some nice diagrams.
- Mobility: Marine positions should permit �escape routes�.
- Speed: Marine units should not move too slowly.
- Weapons safety: Marines should avoid pointing weapons at one another.
- Weapons coverage: Marines should "cover" dangerous locations with their weapons.
- Surrounding: Marines should surround a building properly.
- Leadership: The leader of a Marine unit should maintain contact with subordinates.
We discuss each of these in turn.� These will need to be supplemented by higher-level measures such as the time to perform a task or the minimum weapons safety over a task, but this paper addresses only the instantaneous measures.
Static analysis of positions
Dispersion
Dispersion is the degree to which the unit is spread out across the terrain, with the goal of making it harder for adversaries with firearms to easily shoot them.� It is really only the distance to the nearest Marine that matters for each Marine, as is suggested by work on automated location dispersion for coordinated tasks (Hsu, Jian, & Lian, 2006).� Thus we use for the N Marines where d represents distance:

Both small and large values of F2 are problematical.� Small
values mean the Marines are more vulnerable to a bomb or gunfire; large values
mean the Marines have more trouble communicating and covering one another.�
Thus we assume an optimum distance ![]() �between two Marines, roughly the
width of a road (6 meters) from our observations.� Then we use sigmoid
functions to map deviations from the optimum distance ratio to a range of 0 to
1:
�between two Marines, roughly the
width of a road (6 meters) from our observations.� Then we use sigmoid
functions to map deviations from the optimum distance ratio to a range of 0 to
1:
![]()
Collinearity
Collinear Marines are easier to target.� Two-column movements are standard and often appropriate, but single-column movements are generally a mistake.� We use the Pearson correlation coefficient as our measure of collinearity:

Number of clusters
Another useful measure is the number of positional clusters of Marines within a threshold (call this C2). Clustering is appropriate at base, but not on patrol.� We use the minimum-spanning-tree algorithm to cluster at thresholds of 2.5, 5, and 10 meters respectively.� A systematic way to choose such thresholds is to plot the number of clusters as a function of the logarithm of the threshold, and look for the longest flat stretch of this graph.� For instance, Figure 3 shows the plot for the Marines in Figure 2.� It shows that identifying four clusters is a good way to describe the image (in Figure 3, the clusters in the left foreground, the left back, and two one-person clusters for the two guards on the right) because that is the longest flat stretch on the graph excepting for the stretch at 12 Marines (which is not interesting because it says almost every Marine is in a separate cluster).
Figure 3: Number of clusters (vertical axis) as function of logarithm of distance-clustering threshold (horizontal axis) for the Marines in Figure 2.
Interaction with role players
Interactions with non-Marines (generally, �role players� or actors) during exercises are important because they suggest how Marines will interact with civilians during deployment.� Hence we measure conversations between Marines and role players by computing the number of Marines which are facing a role player within 5 meters and where the role player is facing them.� Assuming there are R role players, where d represents distance:
Danger
Marines are trained to be search for potential dangers in their environment.� This is mostly possible sniper positions but can also include visible people and booby traps.� Doors, windows, and building corners are the main such locations.� We can choose their centers as the centers of danger.� Corners do depend on the position of the viewer, as they represent places of a discontinuity in the observed depth as a function of viewing angle in which a sniper could be concealed.� Figure 4 shows example terrain where the yellow dot represents the observer position, light blue represents buildings, dark blue represents walls seen by the observer, and red indicates the centers of edges of possible corner concealment areas for this observer.
Figure 4: Example of visible walls and concealing corners from a fixed viewpoint (yellow).
Then dangerousness of a location is a monotonically
increasing function of the number of doors, windows, and corners that can be
seen.� However, the distance to them is important.� Generally speaking,
targeting accuracy by conventional arms is inversely proportional to distance
at large distances.� At smaller distances the danger is near to uniform with
distance because other senses such as hearing can make it difficult to surprise
someone.� So an appropriate formula for danger with respect to distance is ![]() �for
�for ![]() �some
minimum radius, which we estimated from Marine practice is around 3 meters.
�some
minimum radius, which we estimated from Marine practice is around 3 meters.
Some lesser danger also accrues from the possibility of threats in large unobstructed areas of terrain.� To be consistent with the above formula, the average danger in a circular sector with center (x,y), radius R, and angular extent θ is:

Note that for ![]() �much smaller than R, this is
approximately the danger at R/2, the value halfway down the sector.� For
triangular rather than circle-sector areas created by a wall segment and (x,y),
we can approximate R by the average of the distances from the two wall
endpoints to the (x,y); the above formula will usually be a good approximation
because the only error occurs in the part of the sector lowest in danger.
�much smaller than R, this is
approximately the danger at R/2, the value halfway down the sector.� For
triangular rather than circle-sector areas created by a wall segment and (x,y),
we can approximate R by the average of the distances from the two wall
endpoints to the (x,y); the above formula will usually be a good approximation
because the only error occurs in the part of the sector lowest in danger.
A key factor is how dangerous a given area of unobstructed terrain is compared to a window, door, or corner.� We assumed this was 0.05 of the dangerousness of the same area in a typical Marine training building.� Training usually uses containers of 40 feet by 8 feet with an average of four windows and doors for the 320 feet of area, so we estimate that every 1600 square feet of unobstructed area has the same danger as one window.� Then putting together the danger due to features and the danger due to area and converting to meters, we have:

Here ![]() �is the location of the jth feature
(window, door, or corner) of the F(x,y) visible features from (x,y), and
�is the location of the jth feature
(window, door, or corner) of the F(x,y) visible features from (x,y), and ![]() is the
midpoint of the jth wall of the W(x,y) that are visible from (x,y).� 148.6 is
the weighting used for distances in square meters.� Then the average danger for
a set of Marines is:
is the
midpoint of the jth wall of the W(x,y) that are visible from (x,y).� 148.6 is
the weighting used for distances in square meters.� Then the average danger for
a set of Marines is:
![]()
Danger can be mitigated by having good "cover" nearby.� Cover is defined as low-danger regions into which one can quickly move.� This can be modeled as a "blurring" of the danger array D(x,y) by permitting danger at a point to be reduced by averaging with the minimum danger of all neighbor locations.� It can be computed by a nonlinear convolution.
Situation awareness
Situation awareness is mostly the ability to see adversaries in many directions, though the term is often used to include understanding of one�s context in a mission (Matthews and Beal, 2002).� People see well in the direction they are looking (corresponding to the fovea of their eyes), typically a range of 4 degrees, and to a lesser extent within their field of vision, typically 190 degrees using both eyes and 150 degrees with one eye (Long, 2006).� Decreasing visual acuity with angle can be measured many ways, but a good way that focuses on end results is to look at the amount of cerebral cortex devoted to different parts of the visual field.� This research says that detail at 20 degrees from the center of the fovea is perceived 10 times less accurately; in general, the reciprocal of accuracy is a linear function of angle from the center of the fovea (Anstis, 1998).� However, this is if the viewer does not move their eyes or head; during patrol, Marines are instructed to do much better by scanning their field.� This acts as a blurring (a form of convolution) on the function representing acuity as a function of angle from the fovea.
We can approximate view coverage by a set of Marines by the fraction of danger, as computed by the formula of the last section, that the Marines can see.� For our implementation, we assumed that each Marine has 180 degrees of view and can see half the dangers in their field of view; then assuming independence, two Marines looking in the same field of view can cover 75% of the dangers, and so on.� Since precise Marine orientation is difficult to calculate from images, we assumed that we can only estimate it within 45 degrees.� Consistent with the above discussing of vision, we assumed Marines viewing within 22.5 degrees of the target had twice the effectiveness of Marines viewing within 67.5 to 22.5 degrees of the target, and Marines viewing at more than 67.5 of the target were ineffective at seeing it.
Our implementation of situation awareness calculates the
degree of danger ![]() in each of eight evenly spaced
directions at each point in the terrain, and calculates the overall view
coverage as:
in each of eight evenly spaced
directions at each point in the terrain, and calculates the overall view
coverage as:

Figure 5 shows the inferred visibilities for the terrain in Figure 2 and the group of Marines shown.� The view is now from directly above rather than obliquely as in Figure 2.� Brightness indicates the degree to which the set of Marines has that location in their view.� Here we pretended the burned-out building in the left foreground was still intact and had occluding walls around it.� Our calculation assumes that adversaries are equally visible in all contexts.� This is not true when appearances of adversaries and their backgrounds vary significantly because of the similar colors between uniforms and buildings, the darkness of building interiors, and the use of camouflage.� (Darken and Jones, 2007) discusses such factors that affect visibility, and these can be incorporated into a more comprehensive formula.
Figure 5: Inferred visibilities for the set of soldiers in Figure 2.
Similarly, we can define a measure for how well a given location can see the set of Marines, and display the product of this and one minus situational awareness as an indicator of "blind spots" overlooked by the Marines.� Figure 6 shows the blind-spot values for Figure 2 as the brighter areas.� Blind spots occur here for the interiors of some of the buildings and the front of the image because no Marines are facing the camera.
Figure 6: "Blind spot" measure for Figure 2.
The situation awareness matrix E3(x,y) should be blurred too, but in time not space.� If Marines have viewed a dangerous area and not seen any threats, the dangerousness of that area should be low for a while.� This reduction should exponentially decay over time (i.e., dangerousness should increase).� That is because events like snipers noticing the Marines can be modeled as Poisson processes as a first approximation, where the interval between successive events has a negative-exponential distribution.
Path safety
If we average the danger along a Marine�s path, we have a useful measure for path safety.� We can use this to determine in advance the best paths across the terrain.� We can implement this by doing a branch-and-bound search across a uniform grid using as cell costs the negative of the logarithm of the danger probability (the probability of a Marine being fired upon).� Figure 7 shows the computed optimal paths on the terrain of Figure 2; brightness indicates the degree to which optimal paths with random start and end points visited a given location.� Start and end points were centers of all windows and doors, the corners of buildings, and evenly spaced locations along the border of the terrain.� It can be seen that optimal paths tend to prefer following along walls of buildings where there are no windows, and tend to prefer travel at multiples of 45 degrees in bearing because of the grid approximation of the terrain.
Figure 7: Optimal paths for the terrain in Figure 2, using only the walls shown.
Figure 8 shows linear projected paths (green) and optimal paths (blue) for the Marines in Figure 2.� The mean ratio of projected path cost to optimal path cost over the Marines was 1.59, and the maximum ratio was 2.49.� Since costs were negatives of the natural logarithms of the probability of detection, the ratio of the mean dangers was 4.90 and of maximum dangers was 12.06, which is significant.
Figure 8: Marine bearing optimality analysis.
While these diagrams are useful for understanding the training task, we decided they were redundant with the danger measure described above since we will aggregate danger values anyway for after-action review.� We thus did not use this measure in our final system design.
Mobility
Another safety measure is the degree to which Marines can escape a potentially unsafe situation such as adversarial fire.� This is low among closely spaced buildings and in cul-de-sacs.� We can measure this as the ratio of the area that can be reached in a given time versus the area that can be reached in the same amount of time on unobstructed terrain; the lower this ratio, the less mobility the Marines have.� To find this we can do an equicost wavefront propagation about the starting point of the location of the Marine on a grid overlain on the terrain.� We assume the wavefront cannot penetrate walls except at doors and windows.
To calculate mean lack of mobility, let D be the sum of the height and width of the grid used, w(x,y,j) the number of non-obstacle cells reachable at j or fewer steps in the wavefront propagation from (x,y), and f the fraction of non-obstacle cells in the grid.� Then we want:

Figure 9 shows the mobility analysis for the Marine in the lower left corner of Figure 2.� The darkness of the terrain indicates the estimated time to reach there by wavefront propagation.� The M1 metric can be calculated by taking the average of this within a circle centered on the Marine position (the radius of the circle being the degree of throughness of the analysis) and averaging over all Marines.
Figure 9: Mobility analysis for the Marine in the lower left corner of Figure 2.
Speed
The simplest multistep performance measure is average speed of the group of Marines, measured as the rate at which their center of gravity moves:

Here ![]() �is the number of Marines in image
j,
�is the number of Marines in image
j,![]() is the two-dimensional position of Marine i in image j, and
is the two-dimensional position of Marine i in image j, and ![]() �is the time of
image j.� To compute this with images in our experiments, we need to register
the images so they have the same coordinate system.� We did this by matching
the regions of the images and fitting a linear mapping function from the
coordinates of one image to the coordinates of the other.
�is the time of
image j.� To compute this with images in our experiments, we need to register
the images so they have the same coordinate system.� We did this by matching
the regions of the images and fitting a linear mapping function from the
coordinates of one image to the coordinates of the other.
Weapons safety and coverage
Two important measures concern weapons orientation, which
can be calculated from an image with similar methods as body orientation.� We
need to check whether Marines are accidentally pointing weapons at one
another.� The calculation is similar to that for role players, where b
represents the azimuth bearing angle and ![]() �represents the azimuth orientation
of the weapon.� The cube of the cosine seems to give the most reasonable
dropoff in danger with angle.
�represents the azimuth orientation
of the weapon.� The cube of the cosine seems to give the most reasonable
dropoff in danger with angle.

We also need to check how well Marines are "covering" the dangerous areas with their weapons so they can react quickly if a sniper suddenly appears; call this measure WC1.� The calculation is the same as that for situation awareness except for the substitution of weapon orientation for body orientation.
Surrounding a target area
Often Marines must search areas such as buildings.� Doctrine says they should approach the area carefully and surround it before entering.� We can measure if they have adequately surrounded it by checking if a known target is enclosed in the convex hull of the Marine positions, and the distances between Marines are small enough to prevent escape of anyone in the target, say 10 meters apart.
Leadership
Another useful measure is the degree to which the Marine leader is in communication with their subordinates.� We identify the leader prior to each exercise.� A reasonable measure is a function of the number of soldiers the leader can see and their distance away:

where L is in index number of the leader, v is visibility of one point from another, and d is distance.� The constant 0.0025 was chosen to give 50% effectiveness at 20 meters.
Computing the static measures from pictures
The BASE-IT project will use tracking technology from
Sarnoff to obtain the positions of the Marines, and will use video analysis
methods from NPS to determine orientations.� But for the preliminary
experiments reported in this paper, we used photographs of training as input.�
This required an inverse perspective transformation into the map plane (a
"view from above") to calculate our measures.� Elevation differences
among Marines and buildings can generally be ignored because the world is very
close to a horizontal plane.�� But the transformation will be nonlinear because
perspective effects can be significant at these ranges of 10-500 feet.� Generally
our pictures had foreshortening only in the vertical direction with the
distortion being the cotangent of the angle of inclination from the viewer to
the ground.� Then distance can be obtained from the number of pixels from the
bottom of the picture to the vanishing point (![]() ), the angle of
inclination at the bottom of the picture (
), the angle of
inclination at the bottom of the picture (![]() ), and the height of the
viewpoint of the picture above the world plane (h).� A good approximation for
most cameras is that the angle of inclination of the view is proportional to
height in the picture below the vanishing point.� Hence horizontal azimuth
distance of a point at height y below the vanishing point, 0<y<
), and the height of the
viewpoint of the picture above the world plane (h).� A good approximation for
most cameras is that the angle of inclination of the view is proportional to
height in the picture below the vanishing point.� Hence horizontal azimuth
distance of a point at height y below the vanishing point, 0<y<![]() , is
, is
![]() .
.
For horizontal coordinates, we will assume that the picture
is oriented without tilt and the vanishing point is centered horizontally in the
picture.� Good photographers know intuitively how to accomplish these
constraints.� Then the horizontal location in the real world of a point at location
(x,y) in the picture is (measured relative to a line passing vertically through
the center of the picture at ![]() ) is
) is ![]() �where b is the length in
the real world shown along the base of the picture.� We can use d and u to
transform the locations of Marines in the picture to locations in a horizontal
plane containing the Marines in the real world.� Figure 10 shows the locations inferred
by this method for the Marines (green), walls (black), and doors, windows, and
building corners (red) in Figure 2.
�where b is the length in
the real world shown along the base of the picture.� We can use d and u to
transform the locations of Marines in the picture to locations in a horizontal
plane containing the Marines in the real world.� Figure 10 shows the locations inferred
by this method for the Marines (green), walls (black), and doors, windows, and
building corners (red) in Figure 2.
Figure 10: Terrain inferred for Figure 2 viewed from above.
Our preliminary experiments obtained positions of Marines in the picture by asking the user to click on endpoints of walls and centers of doors and windows, as projected to the ground in the image.� Doors and windows are assumed to enable 180 degrees of view.� To get orientations, we used pairs of additional clicks to indicate a direction vector.� We transform points into the world model and compute orientation there.
One problem with reasoning from pictures is that a picture only shows a portion of the world.� Marines, walls, windows, and doors that are not visible are not considered, and this may be important if the picture does not show the entire exercise area.� Thus multi-camera coverage of the training area is a key design feature of our project.
Sample results
We wrote a Matlab program to compute the measures from the pictures described.� As a demonstration, we evaluated five additional pictures besides the previous one (image 40), as shown in Table 1.� Figure 11 shows most of the metrics on the additional pictures in order.
Preanalysis of terrain
Our project will test on Marine training at the Marine bases at Twenty-Nine Palms and Camp Pendleton. �Contractors have built graphics models of two ranges there in the RGB/OBJ format, which includes triangles representing building walls and terrain as well as bitmap images of the walls.� We use this data to do most of the work of calculating danger, situation-awareness, and path optimality in advance of a training exercise, permitting quick real-time calculation of the remaining measures, allowing quick feedback from instructors to Marines.
Table 1: Measure values on example images from Twenty Nine Palms.
|
Measure / Image number |
40 |
23 |
45 |
78 |
62 |
81 |
|
D3, probability the distance is abnormal |
.044 |
.162 |
.113 |
.283 |
.328 |
.609 |
|
U3, probability the uniformity is inadequate |
.756 |
.771 |
.623 |
.198 |
.689 |
.696 |
|
P4, linearity |
.085 |
.833 |
.075 |
.613 |
.002 |
.161 |
|
C2a, number of clusters within 3 meters |
10 |
5 |
6 |
6 |
7 |
2 |
|
C2b, number of clusters with 10 meters |
4 |
5 |
1 |
5 |
1 |
1 |
|
R1, number of roleplayer conversations |
0 |
2 |
0 |
0 |
8 |
0 |
|
V4, danger |
.260 |
.341 |
.289 |
.871 |
.158 |
.210 |
|
E3, situation awareness |
.438 |
.238 |
.348 |
.716 |
.380 |
.149 |
|
WS, weapons safety |
.181 |
.663 |
.745 |
.630 |
.286 |
.608 |
|
TCWD, too close to windows/doors |
0 |
0 |
0 |
0 |
0 |
0 |
|
TFWC, too far from windows/doors |
9 |
1 |
0 |
0 |
8 |
2 |
|
LD, centrality of leader |
.372 |
.353 |
.595 |
.507 |
.761 |
.933 |
45 23 81
|
|
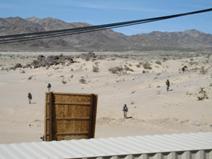
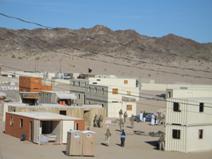
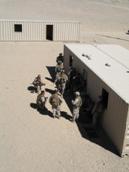
Figure 11: Additional test pictures from Twenty Nine Palms.
We collected the set of triangles for each wall in the graphics models and use the minimum and maximum heights as the extent of the wall.� Each wall has a specified image file.� We analyzed each to find likely windows and doors by smoothing the grayscale version of the image, computing edge cells using the Canny algorithm, and adjusting for about 4% edge cells.� Figure 12 shows an example image of a wall and Figure 13 shows its corresponding segmentation.
To identify windows and doors, we count the edge cells in each row and column and then find the peaks of the counts.� We then iterate over these peaks to find the row1-row2-column1-column2 combinations that correspond to windows or doors of the right shape and in the right locations in the image.� We can exploit the standardized construction methods used for buildings used in training.� Since the buildings are built from up to nine containers of dimensions 40 feet by 8 feet by 8 feet, we also identify lines that represent the seams between containers, and use this to identify how many containers we are looking at, how they are stacked, and whether we are looking at their sides or ends.� Once we have done this, we can estimate the real-world dimensions of each image, which is important since the images differ in scale.� Knowledge of scale aids in the extraction of windows and doors since they are generally 37 inches wide, have tops that are generally 80 inches from the ground, and are no closer than 12 inches to the sides of the containers on the top and sides.� Furthermore, there are never more than one door and three windows on each container side.� These constraints enable us to rule out many false identifications, particularly a problem with the more realistic images from Camp Pendleton.
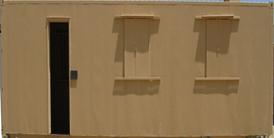
Figure 12: Example graphics rendering of a wall at Camp Pendleton Marine base.
Figure 13: Segmentation of Figure 11.
Once we know the windows and doors for a terrain area, we can compute danger at grid locations by sweeping rays around the terrain and finding the nearest wall intersections.� For the two training areas we studied, we found that doing this calculation for points two meters apart was sufficient.� We can then interpolate these danger values to estimate danger at any desired point, and from that, situation awareness and path optimality.
A key implementation issue is that our calculation of the performance measures discussed here must be fast enough to be close to real-time.� That is because the measures need to be available during training to allow us to flag problematic behaviors.� This requires that positions and orientations be found for Marines within a few seconds, then processed by our calculations.� Hence we precompute the danger and mobility matrices for the terrain before all exercises.
Mapping the measures to the behavioral taxonomy
Appropriate values of the measures will vary depending on what tasks the Marines are performing.� Our BASE-IT project will infer �behaviors� for the set of Marines from their measures.� For example, consider these behaviors during �urban assault� training:
- Waiting for orders at base
- Receiving orders
- Patrol
- Surrounding a building
- Storming a building
We can postulate expected ranges for the measures as in Table 2.� Values inconsistent with these suggest potential problems with the training, though there are valid excuses.
Table 2: Expected values of the measures for five example small-unit behaviors.
|
Behavior |
Waiting |
Orders |
Patrol |
Surrounding |
Storming |
|
D3, probability the distance is too large |
low |
low |
medium |
low |
low |
|
U3, probability the uniformity is inadequate |
high |
low |
low |
medium |
low |
|
P4, square of Pearson correlation coefficient measuring linearity |
low |
medium |
medium |
low |
low |
|
N1a, number of columns using 5 foot grouping threshold |
high |
low |
medium |
medium |
high |
|
C2a, number of clusters of Marines using 10 foot grouping threshold |
medium |
low |
high |
high |
high |
|
C2b, number of clusters of Marines using 30 foot grouping threshold |
medium |
low |
medium |
medium |
medium |
|
R1, number of Marines closer to roleplayer than to another Marine |
low |
low |
medium |
low |
low |
|
E1b, narrow total angle of view coverage by the set of Marines |
low |
low |
high |
medium |
medium |
|
V3, average inferred visibility weighting doors and windows |
medium |
medium |
low |
low |
low |
|
C1, uniformity of speed |
low |
high |
high |
medium |
low |
Aggregation of measures
Additional non-instantaneous performance measures can be built on the aggregates of our basic measures discussed above over each behavior, using averages and extrema.� For instance, we can measure how long a squad spent surrounding a building before they stormed it, and the minimum value of situational awareness over the course of a patrol.� Both of these are important in after-action review.
We will aggregate measures independently for each squad-exercise pair, then for each squad and for each exercise.� Separately, we will aggregate measures for each behavior during an exercise such as patrolling, and then for behaviors over all squads and exercises.� We will also calculate potential problems both with instantaneous measures (such as Marines not watching an area) and aggregate measures (such as Marines having too low average dispersion during an exercise).
Conclusions
The approach we have followed generalizes to many other tasks in which physical motions need to be monitored.� Many military training tasks qualify, such as running a checkpoint, searching a building, establishing a defensive position, and following emergency procedures on a ship.� The overall speed and danger measures need to be adjusted for such applications, but the concepts are similar.� Parts of this analysis may also be useful for surveillance tasks such as watching an area for suspicious behavior (Rowe, 2008) or monitoring elderly people with health problems.
Physical performance is only one aspect of military training, and mental performance is very important too.� We want warfighters to know what they are doing as well as appear to know what they are doing.� (Hone et al, 2008) provides a broader view of the training assessment problem that incorporates such ideas, and (Brunye et al, 2006) suggests that even the higher-level goals of a �warrior ethos� can be measured.
References
Anstis, S.� Picturing peripheral acuity.� Perception, 27 (1998), pp.
817-825.
Blankenbeckler, P., Wampler, R., Dlubac, M., Dyer, J., and Graham, S.� After Action Review tools for dismounted soldier systems, Final report, February 2007 � February 2008, Northrop Bruny�, T., Riccio, G., Sidman, J., Darowski, A., and Diedrich, F., Enhancing warrior ethos in initial entry training.� Proc. Human Factors and Ergonomics Society 50th Annual Meeting, pp. 2634-2638, 2006.
Grumman Corp., Columbus, Georgia, handle.dtic.mil/1002./ADA483160.
Darken, C., and Jones, B., Computer-based target detection for synthetic Marines.� Proceedings of BRIMS Spring Simulation Conference, Norfolk, VA, 2007.
Gately, M., Watts, S., Jaxtheimer, J., and Pleban, R., Dismounted infantry decision skills assessment in the virtual training environment.� Technical Report 1155, Scenpro, Inc., www.hqda.army.mil/ari/pdf/TR%201155.pdf, March 2005.
Hixson, J., Battle command AAR methodology: a paradigm for effective training.� Proc. Winter Simulation Conference, pp. 1274-1279, 1995.
Hone, G., Whitworth, I., Farmilo, A., and Swift, D.� The case for coarse-grained after action review in computer aided exercises.� Proc. 13th Intl. Command and Control Research and Technology Symposium, Seattle, WA, June 2008.
Hsu, W.-H., Jian, Y.-L., & Lian, F.-L.� Multi-robot movement design using the number of communications links.� Proc. Intl. Conf. on Systems, Man, and Cybernetics, Taipei, Taiwan, pp. 4465-4470, October 2006.
Kluger, A., and DeNisis, A., The effects of feedback interventions on performance: A historical review, a meta-analysis, and a preliminary feedback intervention theory. Psychological Bulletin, 119, 254-284, 1996.
LaVoie, N., Foltz, P., Rosenstein, M., Oberbreckling, R., Chatham, R., and Psotka, J., Automated support for AARs: exploiting communication to assess team performance.� The Interservice/Industry Training, Simulation, and Education Conference (I/ITSEC), December 2008.�
Matthews, M., and Beal, S., Assessing situation awareness in field training exercises.� U.S. Army Research Institute for the Behavioral and Social Sciences, Research Report 1795, handle.dtic.mil/100.2/ADA408560, September 2002.
Rowe, N., Interpreting coordinated and suspicious behavior in a sensor field.� Proceedings of the Meeting of the Military Sensing Symposium Specialty Group on Battlespace Acoustic and Seismic Sensing, Magnetic and Electric Field Sensors, Laurel, MD, August 2008.
U.S. Marine Corps, Military operations on urbanized terrain (MOUT).� Marine Corps Warfighting Publication MCWP 3-35.3, 1998.
U.S. Marine Corps, Infantry training and readiness manual.� Directive NAVMC DIR 3500.87, September 2005.
U.S. Marine Corps, SPMAGTF(X) MOUT training program of instruction: dismounted urban patrolling.� Retrieved from www.geocities.com/Pentagon/6453/, dated February 1998, retrieved February 2008.
Acknowledgement: This work is part of the BASE-IT Project sponsored by the Office of Naval Research.� The views expressed are those of the author and do not necessarily represent those of any part of the U.S. Government.� Thanks to E. John Custy and Matthew Denney for help with this paper.