Abstract
Honeypots are computer systems that try to fool cyberattackers into thinking they are ordinary computer systems, when in fact they are designed solely to collect data about attack methods and thereby enable better defense against attackers. Honeypots are more effective the more ordinary they appear, but so far designers have just used intuition in designing them. So it is valuable to develop metrics for measuring the effectiveness of honeypot deception. We report on several software tools we have developed for assessing the effectiveness of honeypots, particularly a metric-calculating tool that summarizes a file system by a vector of 72 numbers. Comparison of vectors between fake and real systems can guide design of the fake. We show that this metric tool, applied to a detailed fake file system we constructed, confirms that it is convincing in most ways.
1. Introduction
Honeypots try to entice software attacks with the aim of collecting information about attack methods, by deliberately permitting most attacks and logging everything that happens [23]. They are an increasingly important tool for information security for when access controls (passwords and encryption keys) are circumvented due to the flaws in software; they are also important as one of the few methods for detecting new kinds of attacks. They can also be used offensively, as when an enemy computer contains "disinformation" deliberately constructed to mislead, or when a malicious network site tries to steal information from users [17]. Honeypots can be specialized to provide traps for email or worms [16], and can be generalized to "honeytokens" or individual pieces of disinformation [24], but we will focus here on their traditional form of a full computer system.
Honeypots are only effective if they can deceive attackers into thinking they are normal computer systems. Most attackers do not want their methods known because they know that will lead to quick development of defensive methods to thwart them. So many attackers (including automated ones) will leave a computer system if they suspect it is a honeypot. For instance, many automated attacks look for the VMWare virtual-machine package on a system they are attacking, as it is often associated with recording their activities, and kill their processes if so.
An important purveyor of honeypot products is the Honeynet Project [9]. They provide a variety of free open-source tools for building honeypots. Currently their most comprehensive monitoring tool is Sebek, software that runs in a disguised background mode on a computer and relays decoded command information to an external archive (thereby defeating the new breed of attack tools that encrypt their message traffic to impede monitoring). A recent paper [3] claims Sebek can be detected by several clues in main memory. If this is true, this is a serious problem since Sebek is otherwise well-disguised. Generally, however, trying to detect deceptive computer systems by checking small details is a poor strategy since it is often easy for deception designers themselves to find and eliminate such clues; for instance, once the Honeynet Project people heard preliminary results of [3], they fixed some parts of Sebek. So it would seem that a more robust strategy for detection should examine broad properties of a computer system that are harder to modify.
Fake digital information can easily look real because computers copy information effortlessly. But internal inconsistencies can still occur with digital information. Honeypots are actually hard to make thoroughly convincing because they do not have normal users and usage patterns. They should not have normal users because distinguishing attacks is then more difficult, and normal users could easily get hurt by the attacks allowed on these systems. So honeypot files can easily look suspicious, not even considering what is in main memory. It would thus seem important to develop methods for creating realistic-looking files for honeypots, files that could at least fool attackers looking at their directory listings. But it will not work to just copy a real file system because an attacker who finds identical copies of user files will quickly become suspicious.
We can distinguish three main problems in designing and using honeypots:
- The deception problem: Design a honeypot to look like a normal computer system.
- The counterdeception problem: Given a computer system, decide whether it is a honeypot or not. This is useful for assessing if a honeypot will fool an attacker; it is also useful for testing whether the files of a captured enemy computer are disinformation.
- The counter-counterdeception problem: Design a honeypot to be maximally effective at fooling attackers into thinking it is a normal computer system.
This paper will present tools for these three problems with a particular focus on the last.
2. Background
2.1 Deception
Deception has many applications to law, government, psychology, and entertainment [6]. Deception and counterdeception are an accepted part of warfare in particular, as a way to maximize leverage in a situation with a fixed amount of resources. One can fool an enemy into overestimating your resources to scare them away, or underestimating to enable a devastating counterattack.
Attacks on computer systems are a form of war. For fun, or increasingly for profit, "hackers" are trying to subvert computers attached to the Internet with a wide variety of ploys that exploit weaknesses in computer software, and new attack methods are being continually discovered. So attackers usually have the advantage in cyberspace, and deception would seem a justified tactic of defense.
Many researchers have proposed models of deception. [22] identifies six kinds: masking (making a feature of the real become invisible), repackaging (making something appear falsely to be irrelevant), dazzling (inducing information overload), mimicking (making something appear falsely to be relevant), inventing (creating a new reality), and decoying (luring the target away with an apparently better reality). Creating fake file systems is a form of mimicking with inventing.
Our previous work [19] provided a theory of deception based on semantic case theory, and applied it to deception in information systems. Examining the 21 proposed defensive deceptions there, the best ones for honeypots are (1) deception in object, deceiving as to the reality of the files and directories shown; (2) frequency, deceiving as to the activity rate at a site; (3) time-at, deceiving as to the timestamps on files; (4) cause, deceiving as to why files are present; (5) purpose, deceiving as to what files are being used for; (6) content, deceiving as to validity of data in files; (7) measure, deceiving as to file sizes; and (8) precondition, deceiving as to conditions preventing access to some files and directories.
2.2 Counterdeception
Two strategies for counterdeception are possible: seeking unconscious clues, and seeking inconsistencies. (They are analogous to the distinction in automated “intrusion detection systems” for defending computer systems [13] between signature-checking and anomaly detection.) Unconscious clues arise when speed is required of a deceiver, and they have trouble controlling all the channels of communication they impart. For instance, a liar may fidget or exhibit an awkward body posture [5]. Other unconscious clues are verbal, such as the number of words used (liars tend to use shorter sentences) and generality (liars tend to be vague). [14] tested and assessed a range of such clues. Other clues are in the presentation or appearance of a fake object, such as evenness of handwriting in written documents [15] and the stylistic consistency of a painting either internally or with respect to similar paintings [11].
Many important unconscious clues are lacking in digital information, such as source, timing, and manner of presentation. Also, a honeypot's deceptions can be designed long in advance and are not subject to real-time human processing constraints. Nonetheless, some clues can occur in the real-time behavior of the honeypot, as in the temporary contents it leaves in main memory and its unexpected delays in processing.
The other approach to counterdeception is the detection of inconsistencies. It is difficult for a deceiver to keep track of a complex deception, and inadvertent mistakes provide good clues [8, 10]. Many forms of inconsistencies are possible, and counterdeception for intelligence analysis requires a flexible frame of mind [22]. [21] makes practical suggestions for detecting deception in general, and tests some of them with agent-based simulation models. They argue for a two-stage model where deception is first suspected and then confirmed.
2.3 Counter-counterdeception
Not much attention has been devoted to counter-counterdeception except in the military literature where concealment and camouflage are emphasized as solutions. Starting principles come from analysis of the counterdeception process: Try to eliminate unconscious clues and inconsistencies. The approach proposed here is to define consistency as compatibility with average statistics.
3. Creating fake file systems
3.1 The NFDir prototype
Several projects have proposed deception as a defense method for computer systems [7, 2]. In our previous work [20] we reported on a fake file system FDir, now developed into NFDir. Accessed via a Web site, the user sees what appears to be a Microsoft MS-DOS directory system, like that obtainable by "Command Prompt" on Windows machines (Figure 1). It displays realistic filenames, directory names, file sizes, and modification dates.
The user can click on directory names to see similar listings for subdirectories down to around ten levels deep. The user can also click on the file names. HTML files provide captioned images on the screen, with images and captions taken from real image-caption pairs on our school's Web site. Clicking on some other files, however, gives a number of error messages, including several kinds of authorization errors, errors in missing software, and errors in files being too large to load. Some files, especially the ".cyc" ones, appear to be encrypted, displaying sequences of random characters. In addition, as one gets deeper in the file hierarchy, surprising connections start to appear in the directory hierarchy. Figure 2 shows an example of a U.S. Navy historical photograph from 1928 – but in a briefing on job assignments for the naval officers, for which this photograph is not relevant.
This honeypot is developed for a different type of attacker than that of most honeypots, the spy attempting to collect intelligence. Thus it attempts to present occasional mild discrepancies to intrigue the user. The authorization errors (actually randomly generated) and seemingly encrypted files (actually just random strings of characters) are ways to make them think that secrets are being stored here. The other errors and the cryptic context-free nature of the image-caption pairs are designed to provide mild frustration and encourage a spy to explore further. Surprising connections are one the chief things that spies are looking for ("don't tell me what I already know").
How long will this directory information fool a spy? Probably not for long if a spy inspects it closely, as it is generated by a relatively simple program (500 lines of Java code) supplemented by a database of image pointers and captions found by crawling our school’s Web pages [18]. But spies have more important things to do than carefully check directories. Some of NFDir's effectiveness comes from exploiting real file and directory names and their connections. For comparison, an earlier version of the program (Figure 3) used a stochastic context-free grammar to generate pronounceable filenames alternating vowels with consa-
PublicWorks 03/22/03 22:07 <DIR>
ResAdmin 01/05/91 13:45 <DIR>
Research 08/25/95 09:02 <DIR>
SEAprogram.htm 10/14/03 13:59 250
Summer2002 02/00/93 05:02 <DIR>
Tools.rzp 05/23/93 09:24 2523
WebCommittee 01/29/99 11:56 <DIR>
aboutfac 03/17/01 21:03 <DIR>
academics.html 06/18/95 21:37 46
advisory 01/02/90 09:03 <DIR>
airforce 09/09/92 10:13 <DIR>
announcement_april_01_2002_picture.html 08/00/00 09:22 442
announcement_april_02_2002_picture01.html
08/19/99 13:02 18
avsafety 03/05/00 20:09 <DIR>
branding.htm 09/09/01 22:17 911
campus.html 10/14/93 12:43 59
courses.html 05/29/01 05:573 22
cs 11/09/02 01:38 <DIR>
ctiw 01/12/97 09:01 <DIR>
da 09/03/91 16:06 <DIR>
dataprod.html 09/17/99 06:11 53
denardo 06/09/94 17:10 <DIR>
dis-java-vrml 01/12/01 02:08 <DIR>
discovery.html 06/17/92 01:46 5830
dlrc_resources 07/16/03 20:15 <DIR>
elvis_fam.html 01/00/02 23:09 63
elvis_tutor.html 02/19/95 05:04 16
Figure 1: Example fake file directory (NFDir).
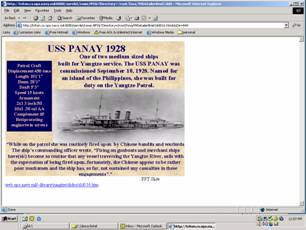
Figure 2: Example fake file-system Web page from directory /root/fsoa/99detailerbrief.
nants) which tend to be more common on real computer systems than unpronounceable ones. While system files tend not to have natural names, partly from the 8-letter limitations on filenames in older systems and partly from the tendency of programmers to over-abbreviate, a whole directory of such names is suspicious.
aonucseydi6.exe 12/18/03 12:054 26382
apsh.rzp 03/19/01 09:19 28685
b6x 10/25/03 20:20 <DIR>
buoano.exe 01/30/03 12:48 2391
difhitvet.rzp 04/14/90 05:22 2479
eooagauymi.rzp 09/19/95 03:14 33096
eopewxulotfoqec 11/08/91 13:07 <DIR>
eucnce l01/30/03 05:09 <DIR>
fqy1n.exe 03/06/02 04:33 28849
k2lam 08/19/97 11:07 <DIR>
ledhet 04/02/02 13:15 <DIR>
limwei 09/16/96 23:00 <DIR>
lowstfe 10/23/96 23:03 <DIR>
nehua.exe 03/00/02 10:03 409768
posnuhlaw.exe 06/16/93 15:03 152252
sodtr 03/21/92 01:29 <DIR>
venpueeee414.gcc 05/31/92 07:08 1369
x6fub 10/19/03 19:07 <DIR>
y1ytr31.rzp 03/00/02 07:23 5429
Figure 3: Example earlier fake-directory information (RDir).
Can we capture our intuition that Figure 3 is more suspicious than Figure 1? If a directory is fake, it must depart from reality to some extent, but we want to minimize suspiciousness. Suspiciousness analysis really requires an automated tool because good attackers automate their analysis of our computer systems with their own tools.
3.2. Principles for building fake file systems
NFDir suggests a good general approach to building a honeypot file system: Use pieces of real file systems but add a certain degree of randomness to provide the variety and unexpectedness typical of a population of similar real systems. So if we want to imitate an office's word-processing computers, we should take pieces from those computers. Randomness can be accomplished in several ways while preserving the overall character of the source directories:
· We can copy files (or at least their directory information) from real systems with a large but not certain probability. We did this for NFDir by copying from Web pages at our institution.
· We can copy a few files to different places in the corresponding file system than those they originate in. We did this in NFDir with a probability of 10%.
· We can change the directory tree occasionally to put whole subdirectories in different locations. We did this in NFDir for 10% of the subdirectories.
· We can create fake directory information using a grammar for the words and numbers, using data from real directories. We did this for NFDir size and date information.
· We can create completely fake files by random number generators (which suggests encryption). We did this in NFDir for the ".cyc" and ".enc" files.
· We can create completely fake files by combining pieces of real files. NFDir extracted images and nearby text from Web pages to create new HTML files.
· We can avoid creating some indicated fake files by setting their access rights to make them inaccessible to all users. We did this in NFDir with 10% of the remaining types of files.
4. Counterdeception for file systems
Following section 2.2, good counterdeception needs to examine both inadvertent clues in small details (suspicious features) and inconsistencies with respect to normal behavior (anomalies). A good counter-counterdeception strategy should do both too, then modify the file system to eliminate the details and anomalies discovered.
4.1 Suspicious features
[3] is the only good example of the suspicious-feature approach to honeypot analysis with which we are familiar. (Some "hacker" sites claim similar capabilities but rarely do the clues they propose work with any degree of generality.) Their results come from careful analysis of a running installation of Sebek, probing to find clues to its concealed operation. Such a manual approach requires extensive knowledge of an operating system. Many (but not all) attackers of computer systems either do not have the knowledge or the time to use it. Thus a manual counterdeception strategy may not often be possible.
Detection of suspicious features of honeypots can also be made harder for determined attackers by making the code of the operating system and software less understandable. This is known as "code obfuscation" [12], and a variety of simple techniques are effective for it; it is also practiced by writers of viruses, worms, and other kinds of Trojan horses. However, it is only necessary for a honeypot to disguise a few key suspicious features of its operations, like the forwarding of monitoring data across the local-area network.
Another good counter-counterdeception approach is an "experimental" one. Install a particular kind of honeypot and characterize statistically the attacks that are aborted against it; then remove some feature of the honeypot and see to what degree attacks change. The degree to which attacks increase indicates what proportion of attackers are noticing that feature and leaving because of it. This can be done for any number of features of a honeypot, even those that hurt its functionality, provided secure auditing is done.
4.2 First-order statistical metrics on file systems
Anomaly-based counterdeception can calculate statistics on a file system and its subdirectories, and compare these between a suspect system and a typical real system; significant discrepancies suggest deception. For this to be useful for counter-counterdeception, statistics are needed for all easily observed features of a file system, like how typical the directories and the directory tree appear. Work in computer architecture such as [4] has computed some metrics relevant to performance analysis of computer systems, but we need metrics related to the psychological perceptions of a user.
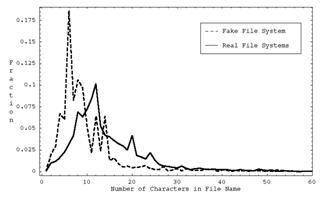
Part of this is the a priori likelihood of each individual file or directory listing, what we call "first-order" statistics. For instance in Figure 1, “Public Works”, “Research”, "Summer2002", and "Web Committee" are plausible names of directories for an academic institution. For this analysis, we should split words into subwords when we can; announcement_april_01_2002_picture.html is plausible because each of its six words is common. Acronyms like "cs" and "ctiw" are rare, but the class of short acronyms is common as a whole in organizations.
We can also assign likelihoods to other information about files. In our fake directory system, the extensions “htm”, and “html" are familiar, "rzp" looks similar to the common “zip”, and "cry" suggests “cryptographic”, a plausible adjective for a file. We can assess the likelihoods of the file sizes (the last items on each line of Figure 1) using the mean and standard deviation of the distribution of their logarithms, which tends to be normally distributed. As for dates and times, we can also compute a mean and standard deviation, but it is also helpful to obtain the mean within the day, within the week, and within the year to see periodic patterns. A vector average of unit vectors is appropriate for periodic values like time in the day, where the direction of the vector corresponds to time modulo the period. We can also measure typicality of substructures in files, such as how often a document has an abstract or a graphical header.
Statistics on directories are less variable than statistics on files and thus more useful for assessing the reasonableness of a file system. For instance, we can calculate the mean, standard deviation, smallest, and largest file sizes in a directory, the number of characters in a filename, or the date a file was last modified. We can take a weighted average of different metrics to get a cumulative metric with distribution closer to a normal distribution, and we can apply tests of significance to values obtained from this metric to assess to what degree a file system is suspicious.
4.3 Second-order statistical metrics
Other metrics for a file system concern the relationships between files and between files and directories, what we call "second-order" statistics. Standard deviations over a file directory of individual file metrics are a good example, since they are larger when directories show more diversity. Minimum, maximum, median, and other order statistics can be considered second-order as they characterize the distribution of a directory. Another example is the similarity in the names of files in a directory. Other second-order statistics can be computed between files in different directories, such as compatibility between cached files and their current counterparts, but we ignored these since they require more work for an attacker to check.
5. Experiments with counterdeception metrics
As a testbed for these ideas, we developed a software tool in Java to compute metrics on file systems. It can analyze around 1500 average directories per minute on a recent Pentium computer. An advantage of Java is that the same program (class file) can analyze a file system on any machine with the Java Run-Time Environment, including Windows, Linux, Unix, and Macintosh machines.
5.1 The metrics used
The tool calculates 36 basic metrics on each directory of a file system. Statistics are aggregated for each directory with those of its subdirectories. The metrics were chosen to reflect features most obvious in a quick inspection of directories: the form and types of filenames, the types of files, the sizes of files, the date distribution, and the shape of the directory tree. They were:
0: Number of files in the directory
1: Depth of the directory in the file hierarchy
2-6: Fraction of system, document, audiovisual, Web, and program files in the directory
7: Fraction of files with names that are single English words
8-11: Mean, standard deviation, minimum, and maximum filename length in the directory
12-15: Mean, standard deviation, minimum, and maximum of the natural logarithm of the file size of a file in the directory (file sizes tend to be logarithmically distributed [25])
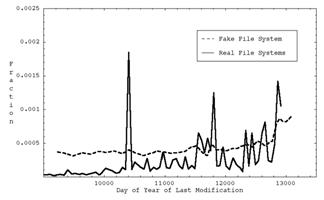
16-19: Mean, standard deviation, minimum, and maximum day of last modification of a file in the directory
20-23: Mean, standard deviation, minimum, and maximum time within the day of last modification of a file in the directory
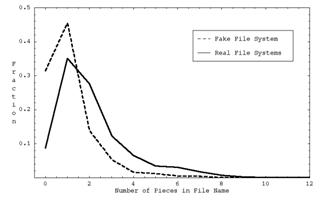
24-27: Mean, standard deviation, minimum, and maximum number of pieces in the filename of a file in the directory
28: Mean similarity of the filename pieces to directory name pieces, excluding common words and eliminating suffixes, and including front-letter and abbreviation matches weighted at half the importance (so directory "graduation_pictures_2005" matches file "2005_grad_ceremony1" with a weight of 3, 2 points for "2005" and 1 point for "graduation")
29: Mean similarity of the filename pieces within the directory
30-31: Statistic 8 for just system and document files respectively
32-33: Statistic 12 for just system and document files respectively
34-35: Statistic 16 for just system and document files respectively
Our program calculates these basic metrics for each directory as well as their standard deviations (weighted by directory size) over all directories, for a total of 72 vector components for each directory of each computer system. Standard deviations over all directories are important, as for instance a system with exactly 16 files in every directory is suspicious. The standard deviation, minimum, and maximum statistics within a directory as well as statistics 20 and 21 are second-order statistics, and the rest are first-order statistics. Statistics were mapped to 32-bit integers to save space.
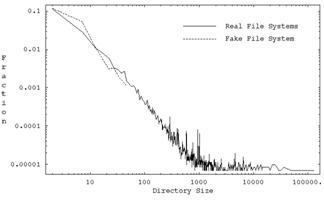
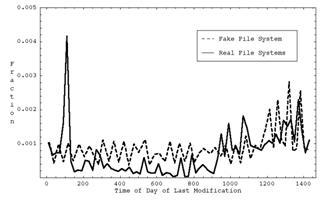
Table 1 shows some example metrics for five systems at our institution: (1) a computer-science Unix file server at our school, (2) an operations-research Unix file server, (3) an oceanography Unix file server, (4) our office desktop Windows machine, (5) and the Linux machine of a colleague. The differences in the statistics suggest important differences in the usage of the computers. Indeed, our metrics tool could be a good way to analyze usage patterns.
Table 1: Ten representative metrics on five file systems.
|
Metric |
Sys. 1 |
Sys. 2 |
Sys. 3 |
Sys. 4 |
Sys. 5 |
|
Total files |
215814 |
50860 |
315678 |
81346 |
2,515,746 |
|
Av. dir. size |
19.2 |
18.2 |
76.3 |
18.5 |
76.3 |
|
# doc. files per directory |
0.3 |
0.9 |
0.26 |
1.4 |
0.04 |
|
# Web files per directory |
1.2 |
0.1 |
0.7 |
0.3 |
0.1 |
|
# of English filenames per dir. |
2.5 |
5.5 |
1.5 |
1.4 |
4.3 |
|
Av. filename length |
8.9 |
9.0 |
10.8 |
10.5 |
6.4 |
|
Av. log of file size |
7.9 |
9.7 |
7.4 |
7.7 |
2.7 |
|
Av. day modified |
11041 |
11459 |
11035 |
11706 |
12341 |
|
Av. minute in day |
936 |
794 |
987 |
932 |
822 |
|
Av. # filename parts |
2.1 |
2.7 |
3.1 |
2.3 |
2.0 |
5.2 Comparing two file systems
We can then compare two file systems as a whole by comparing
the metrics on corresponding directories, especially for the top-level
directories which include statistics on everything beneath them. Comparing
whether two metrics are significantly different is a classic problem in
statistics, for which it is reasonable to assume a normal distribution since we
are summing 72 random variables and the Central Limit Theorem should apply
well. We weight the metrics equally; a more sophisticated approach could learn
weights from training examples. Then the standard error is the square root of
the sum of the squares of the standard deviations of the metrics. This
requires![]() and
and ![]() for
the mean and standard deviation of the metric k for system i. To the difference
in means of metrics we add a factor for the difference in the standard
deviations; we intuitively assessed this effect as being half that of the
difference in means since it requires viewing a set of directories to notice.
To estimate its degree of significance, we estimate the standard deviation of
the standard deviations for metric k,
for
the mean and standard deviation of the metric k for system i. To the difference
in means of metrics we add a factor for the difference in the standard
deviations; we intuitively assessed this effect as being half that of the
difference in means since it requires viewing a set of directories to notice.
To estimate its degree of significance, we estimate the standard deviation of
the standard deviations for metric k, ![]() , by an unweighted estimate over
the set of all known files systems (computing this more accurately would
require doubling the amount of data we collect for each directory and
subdirectory). So in total we compute to compare system i and system j:
, by an unweighted estimate over
the set of all known files systems (computing this more accurately would
require doubling the amount of data we collect for each directory and
subdirectory). So in total we compute to compare system i and system j:

As an example, we compared metrics of two fake directory
systems with those of ten representative machines in our building. Table 2
shows the mean error![]() for each pair of systems.
Table 3 explains the systems referred to in Table 2; "# of files
studied" is the number encountered in the breadth-first search on the
system up to the maximum number that our program could analyze, about 500,000
files, due to Java storage limitations.
for each pair of systems.
Table 3 explains the systems referred to in Table 2; "# of files
studied" is the number encountered in the breadth-first search on the
system up to the maximum number that our program could analyze, about 500,000
files, due to Java storage limitations.