Networks of simple sensors for detecting emplacement of improvised explosive devices
Neil C. Rowe, Ahren A. Reed, Riqui Schwamm, Jeehee Cho, ���Jose J. Flores, and Arijit Das
U. S. Naval Postgraduate School, United States
Abstract
Detection of improvised explosive devices is difficult and requires a wide spectrum of strategies.� Detection during emplacement is the best hope.� Nonimaging sensors provide several advantages over cameras in expense, robustness, and processing simplicity for this task.� We describe experiments with inexpensive commercial sensors, and show how data can be combined to provide monitoring for suspicious pedestrian behavior at a 1-10 meter scale.� Our approach preanalyzes terrain to rate likelihood of emplacement.� We install sensors and monitor the terrain, seeking direct clues to suspicious behavior such as loitering and odd sounds such as excavation.� We also use sensor data to track people by inferring their probability distributions, and use this to detect significant accelerations and atypical �velocity vectors, both of which can indicate suspicious behavior.� We describe experiments we have conducted with a prototype sensor network of eight kinds of sensors, from which it appears that motion and sonar sensors are the most helpful for this task.
Keywords:� improvised explosive device, IED, emplacement, sensors, networks, suspicion, terrain, probability, anomaly
This is Chapter 16 in F. Flammini (Ed.), Critical Infrastructure Protection, WIT Press, 2012, pp. 241-254.
1 Introduction
Improvised explosive devices (IEDs) are an increasing threat to both civilians and militaries.� These are mine-like explosives, often manually detonated, and are ideal weapons for insurgencies.� IEDs have been particular threats to the U.S. military in Iraq and Afghanistan since 2003 (Advanced Professional Education and News Service [1]).� Typically they are emplaced along roads frequented by targets and at locations such as bridges that cannot be detoured.
���� IEDs are inexpensive to produce, can be used anywhere, and can be very effective.� Detection once emplaced is very difficult even with sophisticated remote-sensing techniques.� But emplacement necessarily involves some unusual and suspicious actions with some degree of abnormal concealment.� Detecting emplacement is our best chance for locating IEDs on a local (1-50 foot) scale.� With enough sensors at critical locations, we can do it autonomously and transmit data wirelessly.� If evidence of emplacement is strong enough, security personnel can be dispatched to investigate.� Challenges are in choosing the sensors, their deployment, and what software should look for.
2 Clues to IED emplacement
IED emplacement is a kind of the criminal behavior in public.� Criminal behavior occurs more in publicly-owned and unowned areas (Brower [6]; Bolz, Dudonis, and Schulz [4]) and is localized by assessing the tradeoff between opportunity and risk, as for instance by burglars (Brown and Altman [7]).� Opportunity is affected by the likelihood that victimizable targets will move through an area.� Risk depends on the number of criminals working together, and the likelihood of discovery of the criminal activity either by active surveillance (as by law enforcement) or inadvertent observation by bystanders; the latter is affected by the sense of personal interest in reporting, the extent of investment in the concept of reporting, the ability to identify the activity as suspicious, and the feeling of control by the bystander (Newman [10]).
���� This means that the main clues to IED emplacement are suitability of the location, anomalousness of the behavior, occurrence of goal-changing behavior, and coordinated activity.� Suitability of the location is based on emplacement difficulty, concealability, and ability to escape.� Anomalies can be in time, location, speed, manner, and other properties of the behavior.� Most automated surveillance systems address only anomalies, but this creates significant numbers of false alarms, since many legitimate activities are anomalous such as repairing a road.� Goal-changing behavior is a clue since most people in a public area are passing through, and tend to be consistent in their speed, direction, and manner of motion; significant changes suggest changing of goals (Rowe [13]) reflecting concealment of intentions or opportunism.� Finally, unusually coordinated activity can be suspicious.
2.1 Cameras versus nonimaging sensors
Most work on detecting suspicious behavior has used video surveillance data (Bak et al [2] Barbara et al [3]; Wiliem et al [18]).� But it has several disadvantages.� Cameras are subject to occlusion of view and sensitivity to the angle of view; they do not work as well at night and in storms; images require time and power to transmit; image analysis requires substantial processing and can make many kinds of mistakes; and images risk violation of privacy more than nonimaging sensors.� In view of the seriousness of the IED threat, it is important to also exploit other modalities for detecting suspicious behavior.� Nonimaging sensors provide a relatively independent source of information to supplement image data.� In addition, deception is easier to see with nonimaging sensors because it is more difficult for people to control less-visible aspects of their behavior (Vrij [17]).
���� A disadvantage of nonimaging sensors is that the strength of many signals like audio, sonar, and magnetic ones is inversely proportional to the square of the distance from the source, whereas images have resolution inversely proportional to the distance.� However, IED emplacements are very unevenly distributed and tend to cluster at "choke points" in traffic like bridges, culverts, road narrowings, and road intersections.� At such locations we only need provide coverage within a radius of 3 meters, which we can do well with nonimaging sensors.�
2.2 Prior probabilities for emplacement
A variety of methods have been used for assessing likelihoods of IEDs at a location (Fong and Zhuang [8]; Li, Bramsen, and Alonso [9]; Parunak, Sauter, and Crossman [11]).� Poisson models can work well, but the base rate will vary considerably with the terrain.� Our approach to estimating these base rates is, following the above analysis, to assess factors based on traffic density, suitability of the terrain for emplacement, potential concealability of emplacement and triggering, ability to escape after emplacement or triggering, and degree of community support for emplacement.
���� Video of an area of interest can be recorded over representative periods of time from a fixed camera position and orientation.� Traffic patterns can be found by automatically analyzing the video to find the moving objects.� Our primary interest is pedestrians (Rowe [13]) in a planar area.� We divide the ground plane shown in the camera view into bins, and count the number of occurrences of the feet of people in each bin.� Bins with unusually high counts represent choke points.� We also compute the average velocity vector for each bin so we can note anomalies.� We do this by mapping directions to a range of 0 to 180 degrees to account for bidirectional nature of paths (by doubling the velocity angle, averaging it, and then halving the angle).� Traffic statistics do differ with time of day, day of week, and week of year, and we should calculate averages for a variety of them.
���� Figure 1 shows some example terrain, and Figure 2 indicates by the size of circles the corresponding counts of human presence.� Figure 2 was made from six videos of 30 minutes each taken during the day on six separate days, and shows a view from above for bins of 1.5 meters by 1.5 meters, where the size of a circle is proportional to its count.� The camera location was the origin of the coordinate system, and the line through the camera and parallel to the up-and-down path through the center of the courtyard was the vertical axis.

Figure 1: Example computed background image for video.
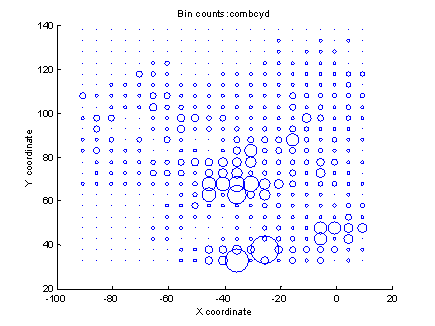
Figure 2: Bin counts for the terrain in Figure 1 as viewed from above.
���� Terrain suitability is another factor in the probability of emplacement.� It is easiest to conceal an IED by burying it, and it is easiest to bury it in unpaved bare ground.� So we create an array corresponding to the 5 foot by 5 foot traffic bins representing terrain suitability.� But all the area within a blast radius of bare ground is also dangerous, so we must "blur" the array by averaging values with those of their neighbors.� The left image of Figure 3 shows the resulting IED suitability for the data in Figure 2, where brighter means more suitable.
���� Another factor is the concealment opportunity.� IEDs tend to be emplaced where partial concealment of the act is possible, and triggermen prefer concealed locations nearby.� We calculate the first kind of concealment as:
![]()
where b gives the distance in the map plane of the nearest occluding obstacle from (x,y) in the direction of its third argument (Rowe et al [14]).� Concealment was not a significant factor for the terrain of Figure 1.
���� Other factors are mobility, nearness to home, and distinguishability.� Mobility on the terrain matters because IED emplacers prefer to get away quickly after emplacement, and IED triggerman need to get away quickly after detonation, as any criminals.� We estimate mobility from the square root of the ratio of the amount of area that can be covered in fifteen seconds from a given location to the amount of area that can be covered on unobstructed terrain (Rowe et al [14]).� The middle image in Figure 3 shows the estimated mobility for the terrain of Figure 1.� Criminals also prefer familiar areas close to their homes but not too close (Rossmo [12]), and this should apply to IEDs.� In addition, the location of an triggered IED needs to be distinctive enough for triggerman to recognize when the target is over it, and for locals to avoid a non-triggered mine-like IED, so areas without landmarks are poor locations for IEDs.
���� These factors for location are generally independent of one another.� Thus the arrival rate of the Poisson process for IED occurrence can be modeled as proportional to the product of their rates, or as:
![]()
where ![]() �is the base traffic rate of
the location,
�is the base traffic rate of
the location, ![]() �is the terrain factor,
�is the terrain factor, ![]() �is the
concealment factor,
�is the
concealment factor, ![]() �is the mobility factor,
�is the mobility factor, ![]() �is the
home-base factor, and
�is the
home-base factor, and ![]() �is the distinguishability
factor.� The right image of Figure 3 shows our combined analysis of the terrain
of Figure 1 viewed from above, where brighter means higher IED probability.
�is the distinguishability
factor.� The right image of Figure 3 shows our combined analysis of the terrain
of Figure 1 viewed from above, where brighter means higher IED probability.


Figure 3: Terrain suitability, mobility, and calculated overall likelihood of terrain in Figure 1 for IED placement.
2.3 Anomalous behavior
Evidence of emplacement behavior can come from sensors.� Most people transit public areas with a straight trajectory of constant speed (nonaccelerating).� This will create a single local extremum of the signal with most sensors.� Suspicious behavior will tend to show many local extrema in a short period.� Figure 4 shows an example of a motion sensor (360-degree infrared) mounted near the center of the circle in Figure 1, where the horizontal axis is time in seconds.� A subject passed the sensor on a nonaccelerating trajectory seven times (seconds 10-120), then loitered within a meter of the sensor (seconds 140-230).� The difference in behavior can be measured by the number of values over 3000 in a time period.
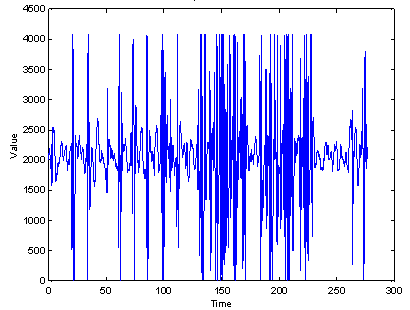
Figure 4: Motion sensor signal during an experiment with transits followed by loitering.
�
�� ��Ranging sensors such as radar and sonar provide a different kind of clue.� Figure 5 shows data from an inexpensive sonar for the same experiment as that of Figure 4.� The default value due to ground reflection can be seen to be 500, corresponding to about 1.5 meters.� Again we see a considerable number of low readings during loitering, measurable as the rate of low values per unit time.
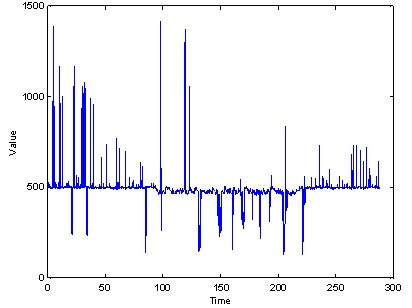
Figure 5: Sonar values for the same experiment as Figure 4.
���� Some clues to suspicious behavior are negative (i.e., they are clues to nonsuspicious behavior), such as sounds of speech and vehicles since they suggest the presence of normal activities and witnesses.� Other clues come from more detailed categorization of a signal such as gaits observed by audio or vibration sensors.� Most human footsteps are regular events 0.4 to 0.8 seconds apart (Sabatier and Ekimov [16]).� Unusually fast gaits suggest running, unusually slow gaits suggest carrying something heavy, and uneven gaits suggest loitering.� All are suspicious.� Stopping or starting suddenly is also suspicious, and is usually signaled by an unusually strong footstep necessary for deceleration or acceleration.
���� It is important to look for anomalies at several different scales of time and space, an important principle in geographical crimonology (Brantingham et al [5]).� So we should look for average rates over 5-second intervals as well as over 0.5-second intervals, and odd behavior should be rounded to the nearest point on a 5-foot grid as well as the nearest point on a 0.5-foot gird.
2.4 Goal changing and coordinated activity
Goal changing, signaled by changes in speed, direction, gait, or sounds, is another clue to possible emplacement behavior.� That is because deception is often associated with goal changing (Vrij [17]) and emplacement almost necessarily must be deceptive.
���� Detection of goal changing from velocity vectors requires tracking of people over a period of time.� This is more difficult with nonimaging sensors than with video, but can be done well when occurrences of people are relatively infrequent as in rural areas.� We infer a probability distribution of human presence from each sensor value over a threshold.� Figure 6 shows the distributions we inferred in our experiments for motion, directional-infrared, pressure-strip sensors in the first row, and sonar, vibration, and audio (footstep) sensors in the second row.� In each case, the sensor was oriented to the north, an inch represents 4 meters, and darkness indicates increased probability.
����
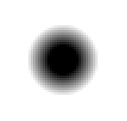


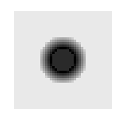
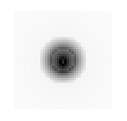
Figure 6: Probability distributions of location associated with the sensors used in our experiments.
To find tracks, we multiply the probability
distributions for sensor values above their thresholds in a fixed time window (one
of 0.5 seconds seemed to work well) to get a cumulative distribution in the map
plane.� We then fit the centroids of probability distributions over time to
line segments in spacetime of the form ![]() .� Figure 7 shows an example
path in spacetime as fit by four sensor processors with six functioning sensors
each.� Least-squares fitting of segments is done by recursive splitting until
contiguous segments are found with sufficiently good fit, then collinear
contiguous segments are merged.� Sufficiently strong discontinuities in the
paths can be considered suspicious.� The spacing of times for fitting can be
0.5 seconds apart (to detect gait wobbling) to 3 seconds (to detect wandering
and stopping) to 10 seconds (to detect loitering).� Figure 7 was obtained from
data of four sensor locations, and smoother paths can be obtained by using more
sensors.
.� Figure 7 shows an example
path in spacetime as fit by four sensor processors with six functioning sensors
each.� Least-squares fitting of segments is done by recursive splitting until
contiguous segments are found with sufficiently good fit, then collinear
contiguous segments are merged.� Sufficiently strong discontinuities in the
paths can be considered suspicious.� The spacing of times for fitting can be
0.5 seconds apart (to detect gait wobbling) to 3 seconds (to detect wandering
and stopping) to 10 seconds (to detect loitering).� Figure 7 was obtained from
data of four sensor locations, and smoother paths can be obtained by using more
sensors.
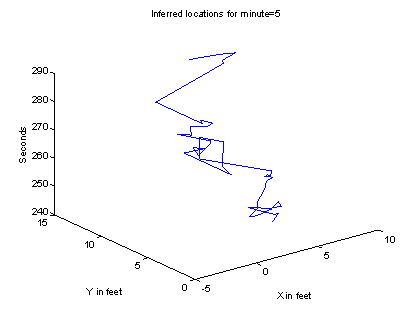
Figure 7: Example inferred path in spacetime of a single pedestrian crossing the sensor field.
�
���� Changes in behavior patterns of a person can also be suspicious, particularly those involving rare behaviors.� Examples of behavior patterns are two people walking together, two people talking while stationary, a person stopping to examine an object, placing an object, removing an object, and excavation behavior.� We can use a case-based approach to classify behaviors using the average velocity and acceleration vectors in different time spans (Rowe et al [14]).
���� Detection of coordinated activity (such as an organized riot) requires more data fusion then the aforementioned types of suspicious activity since interesting coordination can be widely separated.� So it mostly must be done at a base station collecting data from a reasonably large area.� However, coordinated activity near a single sensor processor can also be noted, such as:
� Significant accelerations at nearly the same time but different locations�
� Similar rare behaviors at dispersed locations
� Projected arrivals at the same time and location (suggesting a planned meeting)
We can find the first two by hashing the data onto a limited set of bins representing time intervals, and looking for bins with unusually large counts.� To find similar destinations, we project paths in spacetime based on current velocity vectors and note spacetime bins that have large totals.
3 Sensor management
Since prior probabilities of IEDs vary widely, a "greedy" algorithm for sensor placement is preferable to a placement on a uniform grid:
- Obtain from security experts a distribution r(x,y) of the a priori likelihood of an IED at a location.
- Place a processor at the global maximum of all locations where it can be placed, and assign one sensor of each of the available types to it.
- Recalculate r(x,y), zeroing its values around the last placement point.
- Return to step 2 if processors are unassigned.
- At each processor location, position and orient its sensors to cover the most area.
This algorithm will be optimal whenever the number of potential targets is finite, targets can be covered by a single processor, and targets are further apart than the maximum coverage radius of a sensor.� Such conditions often hold in rural areas such as Afghanistan where IEDs tend to be placed on bridges and culverts.
���� What measures can we take to prevent IED emplacers from vandalizing the sensor network?� We can easily detect tampering in progress from the network data.� Proactively, we can conceal or camouflage the sensors and processors, as by burial in the ground, embedding within concrete, or camouflaging as electrical-power equipment.� While attackers could use metal detectors to find sensors, this is as tedious and time-consuming as attempts to find IEDs themselves, and searching would be highly suspicious in itself.� We could make it harder by deploying many decoy sensors.� Ploys such as exploding dye packs can tag people who tamper with the equipment.� Sensor network designers have an advantage in time and resources on IED emplacers, so they can be clever.
���� Power consumption is a key issue with distributed sensors, and communications require significant power.� Our approach entails that only suspicious behavior need be reported to a base station if coordinated activity is unlikely, and suspicious behavior will be rare.� Prior probabilities for each sensor's range and sensor thresholds can be downloaded in advance to the sensor processors.� Then distributions of location can be calculated by each processor from the reports it receives from its sensors, and anomalous and goal-changing phenomena can be noted locally.� If it is useful to compare data between particular neighbor processors, as on a long bridge, wired connections or Bluetooth networking can be used.� But longer-term tracking, such as for loitering in a hundred-foot area, requires coordinated analysis at a base station through broadband communications.� Bundling of transmissions so they are sent infrequently when no suspicious behavior is detected will also save power.�
���� How do we handle deliberate attempts to overtax the sensor network by large amounts of suspicious behavior?� This is best recognized at the base station.� Transmissions of repeated occurrences of similar data can be aggregated and summarized statistically to reduce bandwidth.� Of course, overtaxing the sensor network is suspicious and deserves investigation too.�
4 Experiments
We conducted experiments with a variety of sensors deployed in both indoor and outdoor public areas.� Terrain preanalysis used data obtained from monitoring the area for 30-minute periods at several times of day.� Usage was calculated for 1.5 meter by 1.5 meter bins, which balanced adequate counts with adequate localization.� Laptop computers ran sets of four to eight sensors each.� Sensors other than microphones came from Phidgets (http://www.phidgets.com) and used their software as well as interface hardware.� The sensor cables averaged 1.5 meters in length, and sensors had a three-meter range on average, so we could monitor an area of about 100 square meters with one set.� The Phidgets sensors we used were motion (broad-range infrared), photocell-type infrared, sonar (1-5 meters), pressure-strip, light-intensity, magnetic, and vibrational.� Of these, the motion and sonar sensors performed best at finding possible IED-emplacement behavior, but both signals were noisy and needed to be averaged over time.� The pressure-strip and infrared sensors were good when they fired, but missed many transits due to their narrow location coverage.� The light-intensity sensor could recognize people in a short range, but saturated easily outdoors and needed to have its light input cut by 90% before it could contribute.� The vibrational sensor was too sensitive to wind to be useful, and the magnetic sensor was insufficiently sensitive to detect anything useful.
���� The microphones were standard cardioid microphones attached with Icicle preamplifiers to the laptops.� Audio and vibrational signals were low-pass filtered to remove frequencies higher than 200 hertz (Rowe, Reed, and Flores [15]).� Following (Sabatier and Ekimov [16]), positive peaks of sufficient height and width were identified as candidate footsteps, and then candidates not in sequences of 0.4 to 0.8 seconds apart of length 3 were ruled out.� We also looked for other loud unrepeated sounds since they can indicate excavation behavior, and looked for speech as a negative clue to suspicious behavior.� Audio analysis caught things that the other sensors did not, but produced many false alarms.
���� Figure 8 shows inferred locations of suspicious activity (the dots) in the representative 9/17/10 experiment in which we used seven sets of sensors plus two additional microphones, and tested a variety of suspicious behavior.� Figure 9 shows five suspiciousness factors and their averages over time (in seconds), smoothed over ten-second periods; heights on the graphs were adjusted to obtain better visual separation.� The five factors were those found most effective during earlier experiments: the terrain likelihood, the suspiciousness of the acceleration norm, the compatibility of the velocity with observed trends, the anomalousness of the motion readings, and the anomalousness of the sonar readings.� The system was successful at recognizing suspicious behavior during times 380 to 450 (dropping and picking up a bag), 690 to 740 (digging with a shovel), 770 to 810 (loitering plus normal activity), and 860 to 910 (loitering plus normal activity). The system was unsuccessful at recognizing the loitering alone at 450 to 650, but this may be due to an airplane passing overhead at 540.�
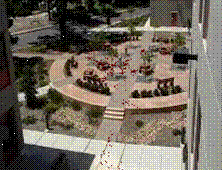
Figure 8: Assessment of locations of suspicious behavior (small dots) for the 9/17/10 experiment.
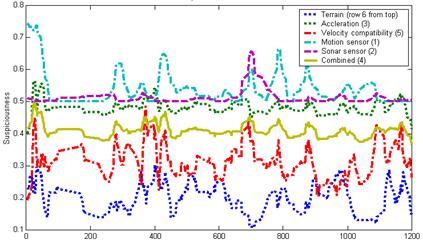
Figure 9: Suspiciousness factors over time for 9/17/10 experiment.
���� The terrain factor was unhelpful because of the kinds of suspicious activity we focused on, but all the other factors were helpful.� In general, performance of our implementation at finding obvious suspicious behavior was excellent, but tracking made mistakes due to the limits on the number of sensors and their area of coverage due to cable lengths.� Most tracking mistakes occurred when subjects were outside the convex hull containing the sensors, so we recommend that be made as large as possible in a deployment.
5 Conclusions
We have shown that IED emplacement behavior can be detected by relatively simple nonimaging sensors.� It does require a careful prior analysis of location likelihood, and we must reason at every time step about both potentially suspicious behavior and the probability distributions of location implied by the sensor values.� This is a relatively novel approach that should provide some diversity in our defenses against these serious threats.
Acknowledgements
This work was supported by the U.S. National Science Foundation under grant 0729696 of the EXP Program.� The opinions expressed are those of the authors and do not represent those of the U.S. Government.
References
[1] Advanced Professional Education and News Service, IEDs - Improvised Explosive Devices (CD-ROM).� Washington, DC: Progressive Management, 2010.
[2] Bak, P., Rohrdantz, C., Leifert, S., Granacher, C., Koch, S., Butscher, S., Jungk, P., and Keim, D., Integrative visual analytics for suspicious behavior detection.� Proc. IEEE Symp. on Visual Analytics Science and Technology, Atlantic City, NJ, USA, pp. 253-254, October 2009.
[3] Barbara, D., Domeniconi, C. Duric, Z., Fillippone, M., Mansgield, R., and Lawson, E., Detecting suspicious behavior in surveillance images.� Workshops of IEEE Intl. Conf. on Data Mining, Pisa, Italy, pp. 891-900, December 2008.
[4] Bolz, F., Dudonis, K., and Schulz, D., The Counterterrorism Handbook: Tactics, Procedures, and Techniques.� Boca Raton: CRC Press, 2002.
[5] Brantingham, P., Brantingham, P., Vajihollahi, M., and Wuschke, K., Crime analysis at multiple scales of aggregation: a topological approach.� In Weisburd, D., Bernasco, W., and Bruinsma, G., Putting Crime in its Place: Units of Analysis in Geographic Criminology.� New York: Springer, pp. 87-108, 2009.
[6] Brower, S., Territory in urban settings.� In Altman, I., Rapoport, A., and Wohlwill, J., Human behavior and the environment, New York: Plenum, vol. 4, pp. 179-208, 1980.
[7] Brown, B., and Altman, I., Territoriality and residential crime: a conceptual framework.� In Brantingham, P. J., & Brantingham, P. J. (Eds.), Environmental Crimonology, Beverly Hills, CA: Sage, pp. 57-76, 1981.
[8] Fong, S., and Zhuang, Y., A security model for detecting suspicious patterns in physical environment.� Proc. Third Intl. Symp. on Information Assurance and Security, Manchester, UK, pp. 221-226, August 2007.
[9] Li, H., Bramsen, D., and Alonso, R., Potential IED threat system (PITS).� IEEE Conf. on Technologies for Homeland Security, Boston, MA, pp. 242-249, May 2009.
[10] Newman, O., Defensible space: Crime Prevention through Urban Design.� New York: Macmillan, 1972.
[11] Parunak, H., Sauter, J., and Crossman, J., Multi-layer simulation for analyzing IED threats.� Proc. IEEE Conf. on Technologies for Homeland Security, Boston, MA, pp. 323-330, May 2009.
[12] Rossmo, D., Geographic Profiling.� Boca Raton, FL: CRC Press, 2000.
[13] Rowe, N., Interpreting coordinated and suspicious behavior in a sensor field.� Proc. Military Sensing Symposium Specialty Group on Battlespace Acoustic and Seismic Sensing, Magnetic and Electric Field Sensors, Laurel, MD, August 2008.
[14] Rowe, N., Houde, J., Kolsch, M., Darken, C., Heine, E., Sadagic, A., Basu, A., and Han, F., Automated assessment of physical-motion tasks for military integrative training.� Proc. Second International Conference on Computer Supported Education, Valencia, Spain, April 2010.
[15] Rowe, N., Reed, A., and Flores, J., Detecting suspicious motion with nonimaging sensors.� Proc. Third IEEE International Workshop on Bio and Intelligent Computing, Perth, Australia, April 2010.
[16] Sabatier, J., and Ekimov, A., A review of human signatures in urban environments using seismic and acoustic methods.� Proc. IEEE Conf. on Technologies for Homeland Security, pp. 215-220, May 2008.
[17] Vrij, A., Detecting Lies and Deceit: The Psychology of Lying and the Implications for Professional Practice.� Chichester, UK: Wiley, 2000.
[18] Wiliem, A., Madasu, V., Boles, W., and Yarlagadda, P., A context-based approach for detecting suspicious behaviors.� Proc. Digital Image Computing: Techniques and Applications, Melbourne, VIC, Australia, pp. 146-153, December 2009.