Automated assessment of suspiciousness of people
in public spaces from path tracking
Neil C. Rowe, Jonathan Roberts, and E. John Custy
MOVES (Modeling, Virtual Reality, and Simulation) Institute
U.S.� Naval Postgraduate School, Monterey , CA 93943 USA
(831) 858-2462, fax (831) 656-2814
ncrowe at nps.edu, jonathan_r@hotmail.com, ejcusty at nps.edu���
Abstract
We assess the suspiciousness of people moving in a public space from images taken one per second.� We track people by comparing difference images with respect to the background and iteratively matching regions.� We then test deception clues of position, velocity, acceleration, relative size, inconsistency in path direction, and path shortness.
Keywords: surveillance, suspiciousness, body, tracking, deception
Introduction
Detecting suspicious behavior in public spaces is important in combating theft and terrorism.� Automated monitoring is helpful because there are so many places to monitor and insufficient personnel to monitor them (Hackwood and Potter 1999).� Suspiciousness is not the same as anomalousness; suspiciousness requires additional evidence of deceptiveness in concealment or switching between goals.� Spatial aspects of crime are studied in environmental criminology (Rossmo 2000) and we can build on some of their results.� This work tested six simple suspiciousness factors from overall-body motions of people moving through a public area.� Limiting ourselves to such motions invades privacy less than methods that analyze faces and gestures (Leibe et al 2005; Meservy et al 2005) and such data is also obtainable from inexpensive networks of nonimaging sensors (Horton et al 2002).
�
Tracking of people
We used mostly standard methods to track people from a fixed camera viewpoint (Aggarwal and Cai 1997; Wren et al 1997; Green and Guan 2004), preferring region matching to particle filtering methods because it sufficed for the required level of accuracy.� We obtained sequences of still color photographs from a fixed camera of public scenes at our school from around 30 meters away.� Most were 320 by 240 pixels (higher resolutions did not provide significantly better performance), and were in sequences of around 100 images taken one per second (like Figure 1).� We constructed a background image for each sequence from nine images spaced evenly through the sequence, processed first in groups of three and then with the three intermediate images.� For each group of three and for each pixel, the color most different from the others was excluded, and the average taken of the remaining two.� Since moving objects were rare at any one pixel, this usually found the background color.� We then subtracted each image from the background image (with overall brightness adjusted to keep constant the mean brightness) and segmented using a difference-magnitude threshold set by training runs to yield 95% of the pixels of people in the images.
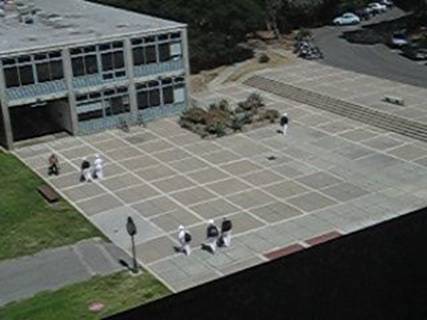
Figure 1: Example surveillance image.
Good estimation of the average size and shape of a person at a location in the image improved segmentation.� We fit regressions for person-region height as a quadratic function of the horizontal and vertical image coordinates.� Another clue is the height/width ratio of people, which averaged around 1.9 for instance for Figure 1.� When difference regions were more than 50% beyond the expected size or width of people (as when people walk side by side), we circumnavigated them to find concave points, then split the regions between pairs of points to maximize the evenness of the split.� When regions were too small (as when color differences disconnected the tops and bottoms of people), we merged the region pairs in good vertical alignment.� We tried to identify head and shadow regions since head regions should not be merged above and shadow regions should not be merged below; head regions are near-circular in a narrow range of sizes, and shadow regions often have low height/width ratios.� To test performance, we noted for six randomly chosen image sequences a total of134 regions that corresponded to most of a person, 8 that corresponded to less than half of a person, 14 regions that corresponded to more than one person, and 25 other regions (most of which due to camera jiggle).� Thus precision of finding whole people was 0.74; recall was around 0.98 since the only missed people were those stationary over 90 seconds.
To match
difference regions between successive images we used the distance between the
vector created from the log of the number of pixels (weight 6), speed (measured
in number of pixels) divided by expected speed at that place in the image
(weight 2), pixel density in its horizontal-and-vertical bounding box (1),
centroid fractional distance from the center of the bounding box (4), log of
height/width ratio (1), average brightness versus the background on a scale of
0-255 (0.02), standard deviation of the brightness (0.02), average redness
(0.02), average greenness (0.02), average blueness (0.02), and moment of the
brightness with respect to height (0.1).� Expected speed was estimated as the
observed average speed of people in images of the same scene times the ratio of
the expected person size at the region to the expected person size at the
center of the image. �Likelihoods l(i,j) for region i in an image matching to region
j in the next image were normalized on the possibilities for matches of i and j
using� ![]() �to
make them more like probabilities; normalization is usually overdetermined
because most regions have few good matches, so we assumed a form of log-linear
model.� Regions can also appear and disappear between successive images (more
likely when near the edges of the image), and these possibilities are included
in the normalization; when no other strong matches are found for a region, normalization
increases the probability of appearance or disappearance.� Regions can also
split and merge between images (as when one person passes in front of another)
but this is discriminated against by the normalization and a reward for
velocity consistency.� Velocity consistency is rewarded by iterative relaxation
over each sequence of three successive images using
�to
make them more like probabilities; normalization is usually overdetermined
because most regions have few good matches, so we assumed a form of log-linear
model.� Regions can also appear and disappear between successive images (more
likely when near the edges of the image), and these possibilities are included
in the normalization; when no other strong matches are found for a region, normalization
increases the probability of appearance or disappearance.� Regions can also
split and merge between images (as when one person passes in front of another)
but this is discriminated against by the normalization and a reward for
velocity consistency.� Velocity consistency is rewarded by iterative relaxation
over each sequence of three successive images using ![]() �where c(i,j,k)
represents the consistency of the velocity between the centroids of regions i,
j, and k from
�where c(i,j,k)
represents the consistency of the velocity between the centroids of regions i,
j, and k from ![]() �where b(i,j) is the displacement
from region i to region j and l(i,j) is the likelihood that region i matches
region j.� After possible matches between images are updated by relaxation, the
probabilities are renormalized.� We exclude matches worse than a certain
fraction of the best match for their associated regions (first 0.1, then 0.2,
and then 0.5), renormalizing each time; a second pass of relaxation is done
before the 0.5 exclusion.� We finally assign the best remaining match choice
for each region in the previous and successive images.� These heuristics
reduced the number of match possibilities by 51% on our images (which averaged
five people per image).
�where b(i,j) is the displacement
from region i to region j and l(i,j) is the likelihood that region i matches
region j.� After possible matches between images are updated by relaxation, the
probabilities are renormalized.� We exclude matches worse than a certain
fraction of the best match for their associated regions (first 0.1, then 0.2,
and then 0.5), renormalizing each time; a second pass of relaxation is done
before the 0.5 exclusion.� We finally assign the best remaining match choice
for each region in the previous and successive images.� These heuristics
reduced the number of match possibilities by 51% on our images (which averaged
five people per image).
After matches are found, we combined them into contiguous paths.� Paths less than 4 segments in length were then excluded, which eliminated 22% of the matches.� Figure 2 shows example paths for 90 seconds at midday through the courtyard of Figure 1.� To test tracking performance, we examined 20 randomly chosen tracks each in 8 representative image sequences.� Precision for track segments (the fraction that did belong to people) was 70% in this sample, and recall (the fraction of people segments it should have found) was 93%.� As expected, the most difficult sequences were those with brightness changes due to cloud cover, scenes with many people, and scenes with glare, for which the precision was 42% and the recall was 92%.
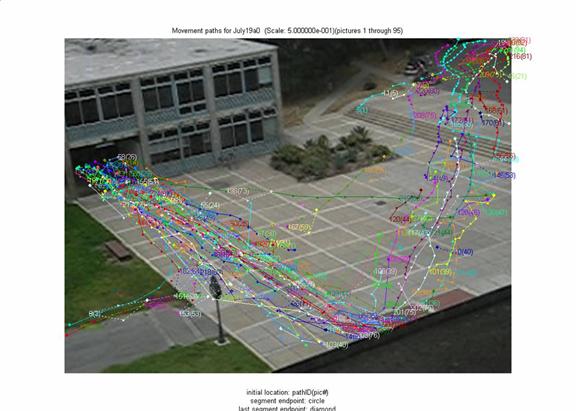
Figure 2: Example paths found by tracking people in a courtyard.
Finding suspicious behavior
The main contribution of this work is to the automatic detection of suspicious behavior from tracks.� To find such behavior, we must look for atypicality, concealment, and goal switching; previous work has focused almost entirely on atypicality.� Paths can be suspicious in exhibiting unusual speeds or directions for a particular area (atypicality, as in (Chu et al 2004)), visiting little-visited areas or exhibiting occlusion by other objects (suggesting concealment) (Rowe 2005), and exhibiting inconsistency in direction or accelerations including turns (suggesting goal switching) (Powell et al 2003).� (Shao 2000) defined atypicality by high velocities, but unusual locations are suspicious when velocities are normal, and nonzero accelerations are related to forces by F=ma and forces often reflect human volition.� Other work has addressed surveillance using multiple cameras (Wu et al 2003) and scene-specific information (Gibbins et al 1996), but our work suggests such additional information may be unnecessary for useful systems.
We estimated typical data for agents in a scene by observing over a period of time and binning the data on a uniform grid, following the spirit but not the details of (Gibbins et al 1996).� Figure 3 shows average velocity vectors (without arrowheads since bidirectional) for the scene in Figure 2 as averaged over 1500 images with interpolation for bins with little data; segment thicknesses indicate the number of data points for that cell.� (Statistics may be time-dependent, as for instance some of these routes were popular only between class hours.)� Circles at the center of each grid square in Figure 3 represent the average degree of visibility of that location from others in the scene.� Criminologists note that crime is more likely when it is concealed in some way (Wood 1981).� We inferred partial occlusion from when the size of people decreases significantly below that which is expected, and full occlusion from when paths are short.
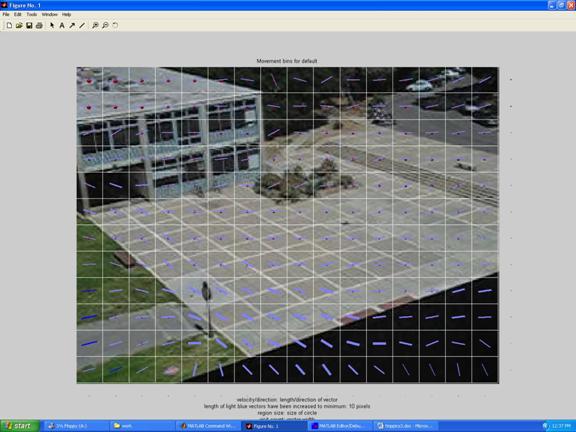
Figure 3: Example average velocity vectors and fractional visibility of people.
We estimated the suspiciousness of the state vector of an agent as a weighted average of the six factors of location, velocity, acceleration, apparent size, inconsistency of path direction, and length of path:
![]() �
�
Here t is
the time an agent is observed, (i,j) is the grid square in which the agent
appears, ![]() terms
are constants set by experiment, h(t,i,j) is the atypicality of an agent in
(i,j) at time t, e(t,i,j) is the atypicality of the velocity of the agent
there, |a(t)| is the observed magnitude of the acceleration of the agent,
s(t,i,j) is apparent agent occlusion,
terms
are constants set by experiment, h(t,i,j) is the atypicality of an agent in
(i,j) at time t, e(t,i,j) is the atypicality of the velocity of the agent
there, |a(t)| is the observed magnitude of the acceleration of the agent,
s(t,i,j) is apparent agent occlusion, ![]() �(�wandering�) is the overall
inconsistency in direction of the agent path, and
�(�wandering�) is the overall
inconsistency in direction of the agent path, and ![]() is the number of segments in the
agent�s path.� The sum of six factors will be more normally distributed than
that of any one factor alone, following the Central Limit Theorem, and thus a
more reliable indicator of suspiciousness.� This formula will flag several
kinds of suspicious behavior: hiding (suggesting attempts to surprise),
too-fast motion (suggesting attacks), too-slow motion (suggesting loitering),
speed changes (suggesting avoidance), and sudden lateral accelerations
(suggesting surprise).� Following experiments, we chose the weights
is the number of segments in the
agent�s path.� The sum of six factors will be more normally distributed than
that of any one factor alone, following the Central Limit Theorem, and thus a
more reliable indicator of suspiciousness.� This formula will flag several
kinds of suspicious behavior: hiding (suggesting attempts to surprise),
too-fast motion (suggesting attacks), too-slow motion (suggesting loitering),
speed changes (suggesting avoidance), and sudden lateral accelerations
(suggesting surprise).� Following experiments, we chose the weights ![]() and�
and� ![]() . Our approach
can be contrasted with more complex approaches like (Green and Guan 2004) that
attempt to classify motions into categories.�
. Our approach
can be contrasted with more complex approaches like (Green and Guan 2004) that
attempt to classify motions into categories.�
Following Occam�s Razor, we used the simplest calculation for atypicality that would exhibit the necessary behavior:
 ����� where g
is the "traffic rate" or average frequency of an agent in a random
grid cell, p(i,j) is the average frequency of an agent in grid cell (i,j), d is
a "double-angle" function described below, v(i,j) the average
velocity vector of an agent in (i,j), v(t) the observed velocity of the agent
at time t, s(t) is the apparent size of the agent at time t, s(i,j) is the
average size of agents in (i,j), and the
����� where g
is the "traffic rate" or average frequency of an agent in a random
grid cell, p(i,j) is the average frequency of an agent in grid cell (i,j), d is
a "double-angle" function described below, v(i,j) the average
velocity vector of an agent in (i,j), v(t) the observed velocity of the agent
at time t, s(t) is the apparent size of the agent at time t, s(i,j) is the
average size of agents in (i,j), and the ![]() �are four times evenly spaced
through the path.� The d function maps a velocity vector to one with the same
magnitude but twice the angle from zero orientation (i.e. d([r,q])=[r,2q]); its purpose is to treat all corridors of motion as
bidirectional, since usually people travel equally often in both directions,
although there are exceptions for queues.
�are four times evenly spaced
through the path.� The d function maps a velocity vector to one with the same
magnitude but twice the angle from zero orientation (i.e. d([r,q])=[r,2q]); its purpose is to treat all corridors of motion as
bidirectional, since usually people travel equally often in both directions,
although there are exceptions for queues.
The suspiciousness metric u(t,i,j) applies to each path segment.� To obtain the total suspiciousness of a path, two possible metrics are the average and maximum values of u over the path: The average is good for detecting loitering, and the maximum is good for detecting brief acts like theft and planting bombs.� So we used an even weighting of average and maximum metrics in our experiments.� Paths are then displayed to the user with a color ranging from blue (nonsuspicious) to red (suspicious), superimposed on a background view of the surveillance area to enable quick assessment.
Experiments
Experiments were done with 39 image sequences taken on 14 different days in July through November of public areas at our school in different lighting and weather conditions.� Five of these included deliberately suspicious behavior enacted by the authors, and the other 34 sequences were normal or �control� behavior.� The average computed suspiciousness value for the paths in the 34 normal sequences was 0.51 with a standard deviation of 0.63, with an average minimum of 0.00 and an average maximum of 1.78.� The average suspiciousness of a path segment in the normal sequences was 0.92 with a standard deviation of 0.27, so consideration of full paths helped reduce false alarms.� In five sequences with deliberately suspicious behavior, the suspiciousness metric was 1.16 for paths loitering behind bushes; 1.16 for meandering; 1.06 for inconsistency in speed along a straight line; 1.12 for leaving a package on a bench and speeding away; and 1.19 for waiting and then following another person.� So suspicious activities averaged 1.00 standard deviations above normal values, enough to helpfully alert security personnel.� In these experiments, the position factor by itself rated suspicious paths 0.25 standard deviations above normal, velocity 1.32 standard deviations, acceleration 0.46, expected size 1.03, path-direction consistency 1.33, and path length 1.13.� But it would be unfair to eliminate position and acceleration as factors due to the limited range of cases studied.� Another useful statistic is that if a suspiciousness threshold of 1.1 were used, all but one of the five deliberately suspicious behaviors would be detected and 30% of the background data would be classified as suspicious.� However, random sampling of these false alarms found that roughly two thirds were due to failures in segment matching (incorrectly matched regions appeared to have large velocity changes), and roughly half of the others were legitimately suspicious behavior such as loitering, so we estimate the false-alarm rate as 5%.� So our broad analysis of suspicious behavior appears to be a success.� This is encouraging for design of inexpensive automated surveillance systems.
Acknowledgements
This work was supported by the Chief of Naval Operations, U.S. Navy, N61F22.� Views expressed are those of the author and do not represent policy of the U.S. Navy.
References
Aggarwal J
and Cai Q (1997) Human motion analysis: a review.� Proc. Nonrigid and
Articulated Motion Workshop, San Juan, Puerto Rico, June, 90-102.
Chu M, P. Cheung, and Reich J (2004) Distributed attention.� Proc. 2nd Intl. Conf. on Embedded Networked Sensor Systems, Baltimore, MD.
Gibbins D, Newsam G, and Brooks M. (1996) Detecting suspicious background changes in video surveillance of busy scenes. �Proc. 3rd IEEE Workshop on Applications of Computer Vision, December, 22-26.
Green R and Guan L (2004) Quantifying and recognizing human movement patterns from monocular video images�part I: a new framework for modeling human video motion.� IEEE Transactions on Circuits and Systems for Video Technology, 14 (2), February, 179-190.
Hackwood S and Potter P (1999) Signal and image processing for crime control and crime prevention. �Proc. Intl. Conf. on Image Processing, Kobe, Japan, October, Vol. 3, 513-517.
Horton M, Broad A, Grimmer M, Pisler K, Sastry S, Rosenberg J, and Whitaker N (2002) Deployment ready multinode micropower wireless sensor network for identification, classification, and tracking.� SPIE Vol. 4708: Sensors and Command, Control, Communications, and Intelligence technologies for homeland defense and law enforcement, 290-295.
Leibe B, Seemann E, and Schiele B (2005) Pedestrian detection in crowded scenes. �Proc. Conf. on Computer Vision and Pattern Recognition, June, 878-885.
Meservy T, Jensen M, Kruse J, Twitchell D, Burgoon J, Metaxas D, and Nunamaker J (2005) Deception detection through automatic, unobtrusive analysis of nonverbal behavior.� IEEE Intelligent Systems, 20(5), 36-43.
Powell G, Tyska L, and Fennelly L (2003) Casino surveillance and security: 150 things you should know.� New York: Asis International.
Rossmo D (2000) Geographic profiling.� Boca Raton, FL: CRC Press.
Rowe N (2005) Detecting suspicious behavior from only positional data with distributed sensor networks. Proc. 5th International Conference on Multibody Systems, Nonlinear Dynamics and Control, Long Beach, California, September.
Shao H, Li L, Ziao P, and Leung M (2000) ELETVIEW: An active elevator video surveillance system. �Proc. Workshop on Human Motion, Los Alamitos, CA, December, 67-72.
Wu G, Wu Y, Jiao L, Wang Y-F, and Chang E (2003) Multi-camera spatio-temporal fusion and biased sequence-data learning for security surveillance. �Proc. 11th ACM Intl. Conf. on Multimedia, Berkeley, CA, 528-538.
Wood D (1981) In defense of indefensible space.� In P. Brantingham & P. Brantingham (Eds.), Environmental Crimonology.� Beverly Hills, CA: Sage, 77-95.
Wren C, Azarbayenjani A, Darrell T, Pentland A (1997) Pfinder: Real-time tracking of the human body.� IEEE Transactions on Pattern Analysis and Machine Intelligence 19 (7) 780-785.
Captions
Figure 1: Example surveillance image.
Figure 2: Example paths found by tracking people in a courtyard.
Figure 3: Example average velocity vectors and fractional visibility of people.