Validation of DGCOM

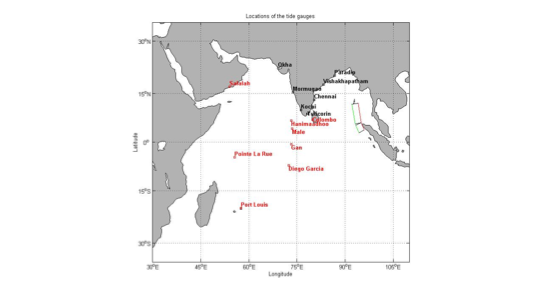
Tide Gauge Data Used to Validate the Model
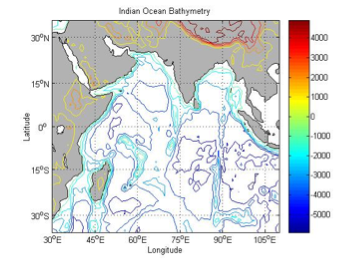
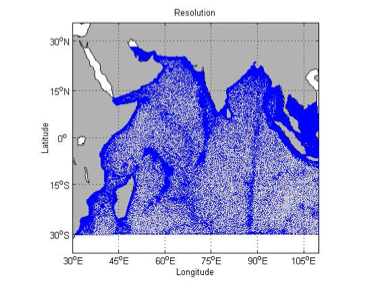
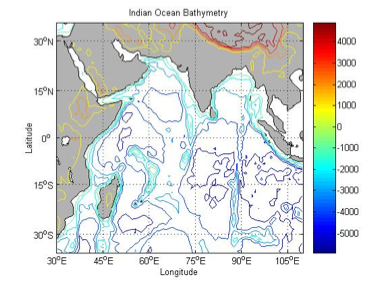
The left panel shows the grid used in the simulation (from the Alfred-Wegener Institute in Bremerhaven Germany) and the right panel shows the corresponding bathymetry.
Grid and Bathymetry
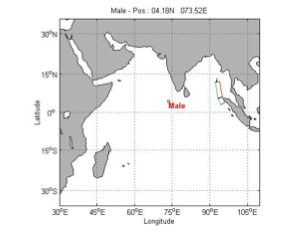
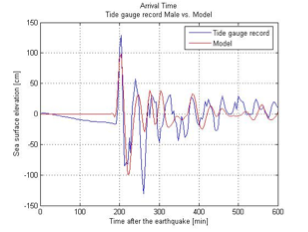
The left panel shows the location of the tide gauge in Male and the right panel shows the wave height as a function of time after the earthquake comparing the tide gauge record with the DGCOM solution.


DGCOM has been validated using tide gauge data collected from the 2004 Indian Ocean tsunami. The text in the above figure indicates the 15 tide gauges used in this validation; the black group was obtained from the National Institute of Oceanography in Goa India while the red group from the University of Hawaii.
Male (Maldives) Tide Gauge Data
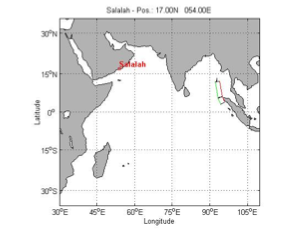
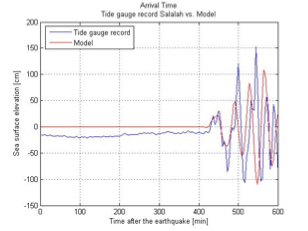
Salalah (Oman) Tide Gauge Data
The left panel shows the location of the tide gauge in Salalah and the right panel shows the wave height as a function of time after the earthquake comparing the tide gauge record with the DGCOM solution.
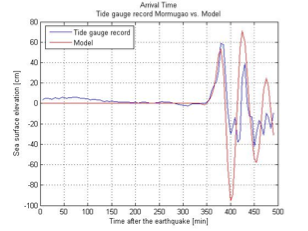
The left panel shows the location of the tide gauge in Mormugao and the right panel shows the wave height as a function of time after the earthquake comparing the tide gauge record with the DGCOM solution.
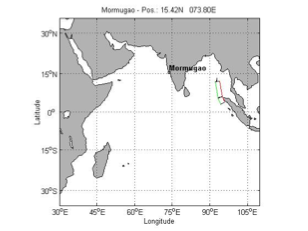
Mormugao (India) Tide Gauge Data
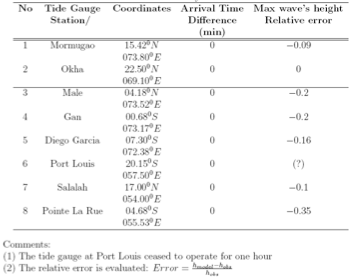
Blue Stations Results
The left panel shows the location of the blue tide gauges (data that will have no reflections from the coast) and the right panel shows the error for DGCOM compared to these stations. Note that there is no error in arrival time, only in the maximum wave height. There was no maximum wave height measure by Port Louis.

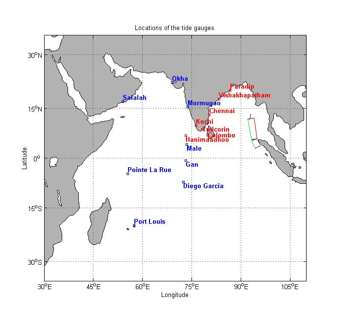
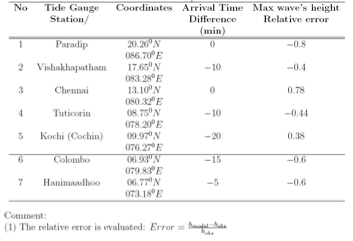
Red Stations Results

The left panel shows the location of the red tide gauges (data that WILL have reflections from the coast) and the right panel shows the error for DGCOM compared to these stations. These are the stations that we would not expect DGCOM to capture well. Nonetheless, 2 stations were captured well (arrival times) while the others had larger errors.
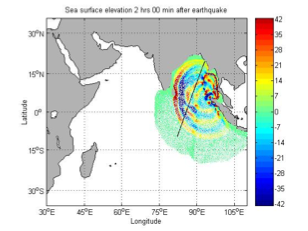
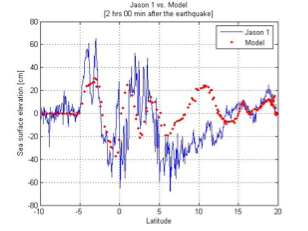
Satellite Altimetry Data

The left panel shows the location of the Jason-1 satellite track at 2 hours after the tsunami (black line) and the color contours show the propagation of the tsunami predicted by DGCOM. The right panel compares the satellite data with the DGCOM simulation. DGCOM accurately estimates the leading wave crest at about 5 degrees S and the double peak structure between this and the equator. Between 5 degrees N to 12 degrees, the model’s crest is in contrast to the observations’ trough. However, between 12 degrees N and 20 degrees N, the model and satellite data are in agreement.
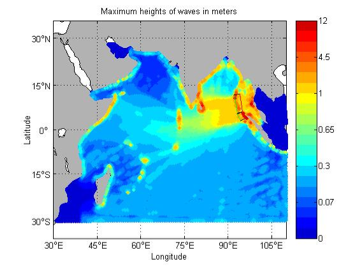
Analysis of Tsunami Strength

The left panel shows the the bathymetry of the Indian Ocean and the right panel shows the maximum wave heights of the tsunami during the entire 8 hour simulation. The model results depict the west south-west propagation of most of the energy due to the orientation of the earthquake rupture (the tsunami wave amplitude squared is proportional to the potential energy). The mid-ocean ridges played a major role as wave guides that transferred the tsunami energy to far-field regions outside the source area in the Indian Ocean.