

- 1. Introduction
- 2. SDCD Setup Description
- 3. DFIM Description
- 4. Lab Instructions
- 5. Measurements
- 6. Report
Doubly Fed Induction Machine Drive Using the SDC2
G. Oriti and A. Julian
Introduction
This remotely controlled laboratory allows the student to experimentally verify the operation of a doubly fed induction machine (DFIM) drive system. The DL laboratory provides the remote students with hardware experience including the ability to change the speed reference and torque applied to the machine. Via a web camera the remote student can see and hear the hardware in real time and acquire the experimental waveforms from the web-enabled oscilloscope.
Objective
The goal of this laboratory is to perform experimental measurements of voltages, currents, speed and power of a DFIM. The measurements validate the DFIM model provided as part of the course material and will reinforce the basic concepts learned during the lectures:
- Speed control
- Operation of the machine as a generator and as a motor
- Super-synchronous and sub-synchronous modes of operation
![]() Please refer to the textbook [1] for details about the machine model.
Please refer to the textbook [1] for details about the machine model.
References
- [1] P.C. Krause, O. Wasynczuk, S. D. Sudhoff, Analysis of Electric Machinery and Drive Systems, IEEE Press, 2002.
Experimental Set-up
Student Design Center Description
The hardware for this laboratory is controlled by a set of embedded electronics boards called student design center version 2 (SDC2). A block diagram of the SDC2 is shown in Fig. 1. The field programmable gate array (FPGA) board is a Xilinx Virtex IV development board [2] as shown on the left of Fig. 1.
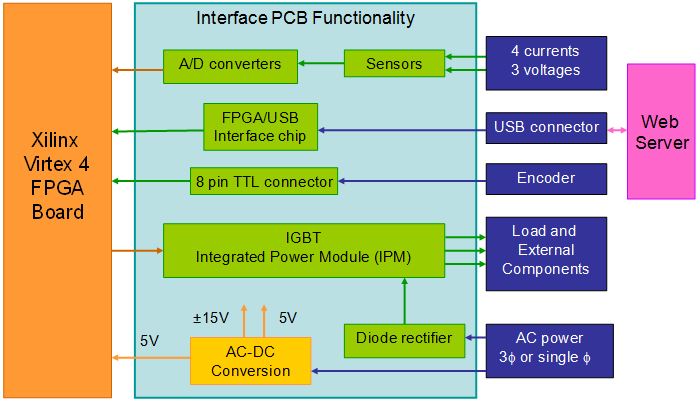
Figure 1: Block diagram of the student design center version 2 (SDC2)
The "Interface PCB functionality" in Fig. 1 is realized by two custom printed circuit boards (PCBs), one for the power conversion components and the other for the signal processing components. The photograph in Fig. 2 shows the hardware which comprises the SDC2 as it is assembled in the lab. The PCB with a power converter includes an IGBT (Insulated Gate Bipolar Transistor) integrated power module (IPM), current and voltage sensors, passive components for the DC bus and the output filter, DC power supply. The IGBT IPM includes six diodes and six IGBTs in the standard three phase three legs configuration. The second PCB includes a USB interface chip, USB connector to interface with the web server, analog to digital (A/D) converters, voltage level shifters and several other connectors to interface with the other boards. This PCB is mounted on top of the FPGA board as shown in Fig. 2.
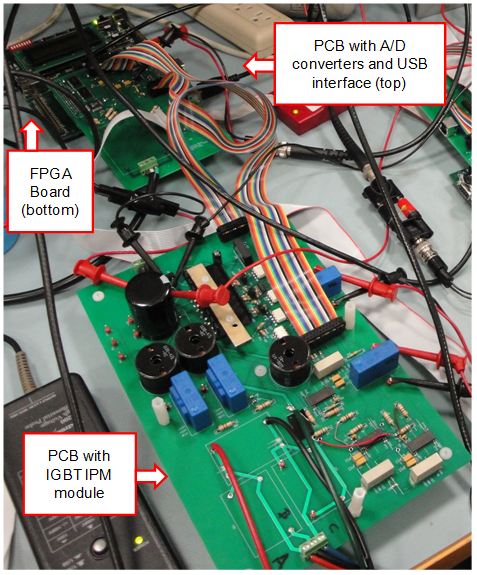
Figure 2: Photo of the SDC2 in the laboratory
The power supply on this board provides power for the power converter board as well. They both can be mounted on top of the PCB with the power converter to create a compact stack. The SDC2 is designed to accommodate several power conversion topologies including DC/DC converters, three phase inverters and rectifiers, for different laboratory set up. For the DFIM drive two SDC2 systems are used, one for the three phase rectifier and one for the three phase inverter as described in the following section.
References
- [2] Xilinx® "Avnet Virtex-4 LC Development Board" online at: http://www.xilinx.com/products/devkits/DS-KIT-4VLX25LC.htm
- [3] http://www.mathworks.com/
DFIM Drive Lab Set Up and Control
Fig. 3 shows a schematic of the laboratory set up including the embedded electronics functionality, power converter topology, machine and measuring tools. The DFIM is rated 0.25 hp and its rotor is controlled by a three phase voltage source inverter. The stator windings are connected to the grid. This configuration is well known and it is sometimes referred to as Scherbius drive [5]. In this configuration the power converter is only connected to the rotor circuit, therefore the drive power electronics need only manage 25% of the power transferred from the machine to the grid when operating as a generator [4]. External torque can be applied to the DIFM from a DC machine that is connected to the DFIM by a rubber belt. The DC motor armature current can be adjusted to achieve different modes of operation of the DFIM. Two SDC2 systems, as described in Section 2.1, are used to implement the double bridge AC-AC power converter shown in Fig. 3.
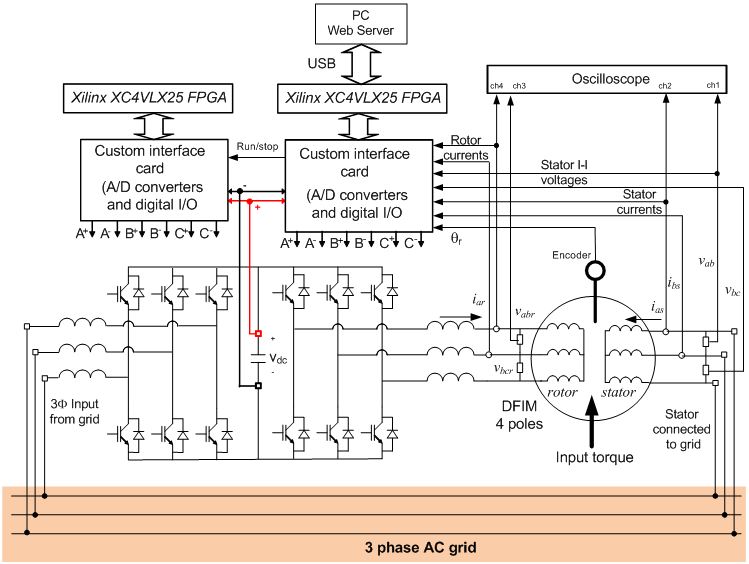
Figure 3: DFIM drive schematics as implemented in the lab
The SDC2 with the inverter is connected to the web server via USB interface for real time communication. Its four current sensors are used to acquire two stator and two rotor currents as shown in Fig. 4. An encoder is also used to measure the DIFM's speed. The SDC2 with the rectifier, once its FPGA is programmed, does not communicate directly to the web server but it communicates with the inverter's SDC2, which handles all communications with the web server.
Fig. 3 also shows the currents and voltages measured and fed back to the FPGA control system including currents and voltages at the stator's terminals and currents and voltages at the rotor's terminals. The AC-AC converter's DC bus voltage is also measured and available on the web user interface. The speed of the DFIM is measured with an encoder and also made available on the web interface.
Fig. 4 shows a block diagram of the inverter control algorithm. A speed reference, ω *r , is the controller input which the user can manually schedule. The speed PI (proportional-integral) controller defines a reference current that is proportional to the torque. The current PI controller defines the voltage source inverter output voltage. The voltage source inverter is controlled using space vector modulation as described in [7]. The rectifier, which controls the DC voltage inside the VSI block of Fig. 3, provides a constant DC bus voltage with bidirectional power flow as described in [5]. All control algorithms are programmed inside the FPGAs in the two SDC2 systems.

Figure 4: Block diagram of the inverter control system
References
- [4] S. Muller, M. Deicke, R.W. De Doncker, "Doubly Fed Induction Generator Systems for Wind Turbines," IEEE Industry Applications Magazine, Vol. 8, No. 3, 26-33, May/June 2002.
- [5] R. Pena, J. C. Clare, and G. M. Asher, "Doubly fed induction generator using back-to-back PWM converters and its application to variable speed wind-energy generation," IEE Proc.-Electr. Power Appl., Vol.143, No 3, May 1996
- [6] G. Oriti, A. Julian, D. Zulaica, "Doubly Fed Induction Machine Drive Distance Learning Laboratory for Wind Power and Electric Ship Propulsion Applications", to be presented at IEEE ECCE 2011, Phoenix AZ, 17-22 Sept, 2011.
- [7] G. Oriti, A. L. Julian, "Three Phase VSI with FPGA Based Multisampled Space Vector Modulation", IEEE Trans. on Industry Applications, Vol. 47, No.4, Jul/Aug 2011.
Power Up
The control box and the main power supply are powered up by the lab technician, with whom the lab time must be scheduled. Once power is applied to the experiment and the DC bus voltage (Vdc in Fig. 3) is set to about 160 V the laboratory is ready to be operated remotely. The voltage applied to the DC bus is displayed in the “DC Bus Voltage” field of the web interface shown in Figure 5.
Push the button labeled “DFIM Power” to turn on the DFIM. The button becomes red when is bushed and remains red for the entire time the DFIM is on. Push the button again to turn the DFIM off after you have completed the lab exercise.
When the DFIM is on, its speed can be changed using the slider labeled “Change DFIM Speed”. After you move the slider the button “Update Hardware” will be highlighted blue. Push this button to change the speed to the new one indicated by the slider. The slider “DC Motor Armature Current” operates the same way. Changing the DC motor armature current results in different loading of the DFIM. The drawing above the controls shows the hardware set up and the power readings for DFIM stator and rotor (left hand side) and DC machine (right hand side).
Note! The power readings oscillate, so minimum and maximum power readings should be recorded and their average should be used to create the power curves required for the lab report.
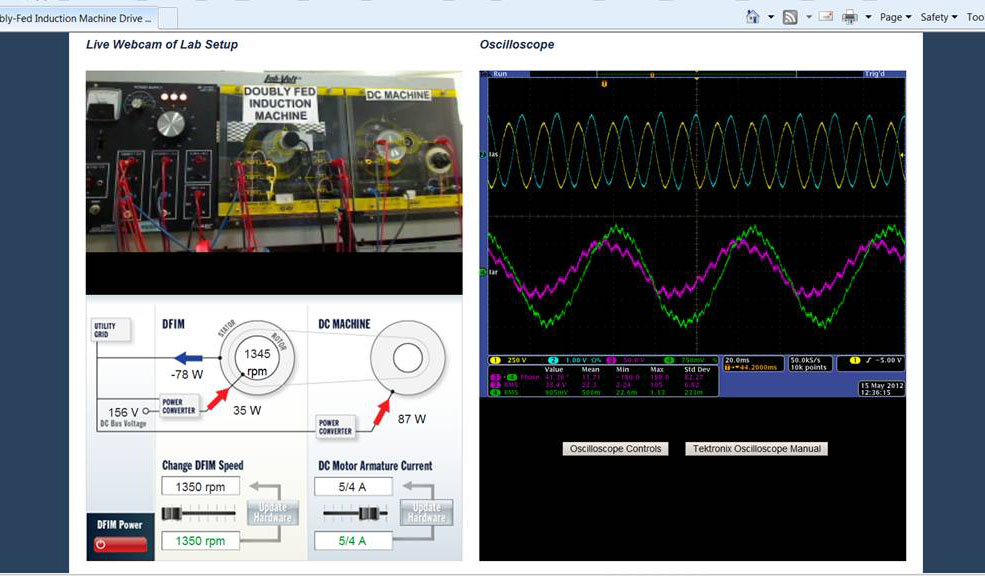
Figure 5: Web browser user interface
Oscilloscope Set Up
The oscilloscope is a Tektronix MSO4034 which is a web enabled with its own IP address. The link underneath the oscilloscope display provides access to the full size oscilloscope page where the oscilloscope can be fully controlled and its waveforms can be acquired in different digital formats. The oscilloscope channels are used as follows:
- Channel 1- stator line to line voltage vab
- Channel 2- stator phase a current ias
- Channel 3- inverter output line to line voltage vabr (filtered)
- Channel 4- rotor phase a current iar
Begin lab at your assigned time slot. Lab opens in new browser window
Measurements
Three sets of measurements are needed to complete this laboratory as described in the following subsections. It is recommended that you read the report section before making the measurements.
Generating mode
The DC motor armature current must be set to a non zero value so that power is being fed from the DC machine to the DFIM. The DFIM therefore works as a generator delivering power to the grid. This is only possible if the power delivered by the DC machine is higher than the losses in the system.
Do the following:
- Check that the DC bus voltage has been set to 160 V and turn on the DFIM on.
- Collect the data to fill out Table I and Table II below for two different DC motor armature currents. Each table requires a different non-zero armature current setting of your choice. Note that the settings 1/4 and 2/4 result in motoring mode, so choose values of armature currents that are 3/4 or higher for tables I and II.
- Set the DFIM speed and for each speed value you set:
- Record the power readings from the user interface. Note that the power readings oscillate, so take min and max readings and average them for your report.
- Record the rms stator and rotor currents using the oscilloscope measurements. Use these measurements to estimate the I2R losses in the machine.
- Take a screen capture of your web browser window as shown in Figure 5, including power measurements and oscilloscope, to help answer the questions in the report section.
- For one speed setting of your choice, compute the rotor power by measuring the rotor current, line to line voltage and phase angle. Compare the computed power to the reading in the user interface.
- Repeat 3 for the stator power.
- Stop the DFIM after completing the data recording.
Download PDF version of tables
Table I: Data for the generation mode with DC motor armature current IDC_arm1= ________
| DFIM Speed [rpm] | Power In DC Motor [W] | DFIM Power In Stator [W] | DFIM Power In Rotor [W] | Stator Current Iasrms [A] | Rotor Current Iarrms [A] |
|---|---|---|---|---|---|
Table II: Data for the generation mode with DC motor armature current IDC_arm2=________
| DFIM Speed [rpm] | Power In DC Motor [W] | DFIM Power In Stator [W] | DFIM Power In Rotor [W] | Stator Current Iasrms [A] | Rotor Current Iarrms [A] |
|---|---|---|---|---|---|
Motoring mode
The DC motor armature current must be set to zero so that the DFIM works as a motor with the DC machine as a load.
Do the following:
- Check that the DC bus voltage has been set to 160 V and turn on the DFIM on.
- Set the armature current to zero.
- Collect the data to fill out Table III below.
- For each row in the table take a screen capture of your web browser window to help answer the questions in the report section.
- Stop the DFIM after completing the data recording.
Table I: Data for the motoring mode with DC motor armature current IDC_arm=0
| DFIM Speed [rpm] | Power In DC Motor [W] | DFIM Power In Stator [W] | DFIM Power In Rotor [W] | Stator Current Iasrms [A] | Rotor Current Iarrms [A] |
|---|---|---|---|---|---|
Lab Report
The lab report should include a write up describing what you learned from the exercise and the following plots:
- Plot individual power readings and total power balance versus speed from Table I.
- Plot individual power readings and total power balance versus speed from Table II.
- Plot individual power readings and total power balance versus speed from Table III.
- For the above plots use the rms current measurements in rotor and stator to estimate the I2R losses in the machine and relate them to the overall power balance. Compare the three plots above with those provided in the class notes [8].
- Oscilloscope waveforms to match simulations for
-
- Generation mode subsynchronous mode stator current and voltage.
- Generation mode supersynchronous mode stator current and voltage.
- Generation mode subsynchronous mode rotor current and voltage.
- Generation mode supersynchronous mode rotor current and voltage.
- Motoring mode stator current and voltage.
- Motoring mode rotor current and voltage.
- Observe/comment on the rotor current frequency that varies as the mechanical speed varies.
- Observe/comment on the rotor power flow reversal which is noticeable by looking and the voltage/current relationship on the scope.
Survey: Please take this short survey to help us improve the effectiveness and usability of this online lab.
References
- [8] A. L. Julian, “Power Flow in an Doubly Fed Induction Generator (DFIG)”, EC4130 class notes, 24 April 2012.