Finding Correlations between Ship Positions
LT Andrew Sollish, Sean F. Everton, Neil C. Rowe, and N. Wayne Porter
U.S. Naval Postgraduate School
GE-328, CS/Rp, 1411 Cunningham Road, NPGS
Monterey, CA 93943 US
indieaman@gmail.com, sfeverto@nps.edu, ncrowe@nps.edu, nwporter@nps.edu
Abstract
To prevent and stop illegal and malicious maritime activity, it is necessary to better understand the people, places, organizations, and vessels that contribute to those activities.� This work examines whether spatial-temporal co-occurrences are useful for finding connections among vessels and providing understanding of their activities.� To identify those occasions, we used two datasets, Automatic Identification System (AIS) records of vessel positions, and time and company information on the ownership of vessels to confirm if vessels were affiliated.� Three experiments studied co-occurrence among groups of vessels that included randomly selected vessels, vessels of interest, and locations of interest.� Vessels were identified for each of the three experiments and their co-occurrences were identified.� We found that co-occurrence manifested in different ways, and while it was not especially useful in demonstrating common ownership among vessels, it was helpful for other purposes.
This paper appeared in the 23rd International Command and Control Research & Technology Symposium, Pensacola, FL, US, November 2018.
1. Introduction
The maritime domain is the primary medium by which freight is transported around the world.� Approximately 80% of global trade by volume is conducted by the shipping industry (UNCTD, 2015).� Unfortunately, some commerce via ship includes illegal activity in the form of piracy, trafficking (drugs, munitions, or people), exploitation of marine resources, violations of environmental law, and other nefarious activity.� (Wallace and Mesko, 2013) describes a complex clandestine Russian maritime network supplying Syria.� Complicating matters are economic and political conflicts that occur inside waters where jurisdiction is highly contentious, e.g., the Spratly Islands in the South China Sea.�
Due to the amount of maritime commerce and the volume of illegal and contentious activity, there is a need to improve maritime domain awareness (MDA) for grey zone activity (activity that occurs on the spectrum between peacetime and conflict).� To prevent and correct malicious activity, it is necessary to better understand the people, places, organizations, and vessels that contribute to those activities.�
One way to improve maritime domain awareness is via the field of social network analysis (SNA).� SNA is a set of theories, techniques, and metrics, borrowed from various disciplines, that are used to study underlying social structures.� It should not to be confused with link analysis, the study of entities connected to other entities (Borgatti, Everett, and Johnson, 2018).� SNA goes a step further, attempting to understand what underlies those connections.� It has been successfully applied to social structures such as religious organizations, companies, and universities, as well as illicit social structures like crime syndicates and terrorist groups.� Recent concern about �dark maritime networks� involving cooperative illegal activities, such as the Russia-Syria network, could be analyzed with SNA. �We need to understand this activity as a first step before planning interdiction and military activities.� We need to rate ships by investigative priority.
Before SNA can be applied to a problem, a network graph must be constructed.� This involves identifying the entities or nodes and the relational connections or edges between them.� In the maritime domain, nodes could be vessels, companies, individuals, and ports.� At present, there are no easy ways to populate network graphs in the maritime domain, especially networks that prefer to go undiscovered.� �Spatial-temporal co-occurrence� could be a way of finding relational connections in a network graph, meaning that two or more entities can be found nearby at the same time.� How one defines �nearby� and �the same time� can be done in several ways.� In the maritime domain, co-occurrence could mean two ships that report their position within a mile within several hours.� For people, even a small number of co-occurrences between them results in a significantly greater likelihood of social connection (Crandall et al., 2010).�
Section 2 discusses related work on co-occurrence applied to areas outside the maritime domain, and the application of AIS in the maritime domain.� In section 3 the details and methods of the data studied for this research are described.� In section 4 the findings are presented and discussed.� Lastly, in section 5 are the conclusions and research suggested for further study.�
2. Related work
2.1.Maritime domain awareness
Real-time ship data is relatively new.� It can provide a rich source of insight regarding historical and present maritime activity and relationships.� (Ray et al., 2013) presents a proof-of-concept for an expert system designed to improve maritime domain awareness.� They suggest a software architecture that takes in dynamic data and uses rules to produce notifications of particular maritime activity.� That activity could be anomalous behavior or notifications when vessels have entered a restricted area.
Using such data to improve maritime domain awareness has limitations.� (Last et al., 2014) reviewed vessel-prediction algorithms and found it to be a difficult task.� One reason is that there currently is a lack of consistency in short-time reporting intervals.� This affects the timeliness of data fields such as rate of turn and heading which are important in predicting vessel-course changes.� Other common problems were incorrect transmitter placement, network overload, land obstruction, and data loss.� The authors concluded that real-time ship data should be supplemented with other data sources.�
2.2.Spatial-temporal analysis
2.2.1 �Animal networks
(Krause et al., 2013) lists a variety of methods for studying animal networks using sensor data rather than by direct observation or survey.� Such sensor data can be generated by the Global Positioning System (GPS), cameras, accelerometers, radar, or any technology able to geo-locate an entity in space and time.� The authors note that large amounts of dynamic data can allow researchers to better understand animal social structure.� They suggest that social-network metrics and hidden Markov models can help reveal routines and behavior that precede certain states.
�
(Psorkis et al., 2015) noted difficulties of doing such research on ecological systems.� They studied thousands of birds marked with transponders on a grid of 16 bird feeders with sensors.� They had difficulty in deciding on appropriate time windows that would yield meaningful social associations.� Time windows too small would miss important co-occurrences, while windows too large would lead to an overrepresentation of social connections.
2.2.2 Phone records
One way of identifying and studying co-occurrences among people is via phone records.� (Eagle and Pentland, 2006) used data from 100 mobile phones on a college campus.� They found that spatial-temporal co-occurrence provided insights into social relationships.� Subjects were asked in surveys to name the people with whom they spent time in and out of the workplace and whom they consider close friends.� The researchers could reach 90% accuracy in distinguishing between colleagues, friends, and �inner-circle� friends using only data from the mobile phones and a Gaussian mixture model.� They further suggest that including communication logs and using more powerful modeling techniques like support-vector machines could increase accuracy.
(Eagle et al., 2009) inferred friendship by classifying proximity by context.� For example, they distinguished proximity events between on-campus and off-campus, daytime and nighttime, and weekday and weekend.� This tested the hypothesis that co-occurrence of people at night and over the weekend at an off-campus locale is a better indication of friendship than co-occurrence during the day in a weekday on campus.� They accurately predicted 96% of reports of non-symmetric friendship and 95% of reports of symmetric friendship.� This work and (Eagle and Pentland, 2006) showed that mobile-phone data is effective at predicting social relationships.
�
(Wang et al., 2009) analyzed the communication records of six million mobile-phone users.� They found a positive correlation between the similarity of users and their closeness within a social network.� They proposed three kinds of connections.� The first is �mobile homophily,� the distance of the nearest cell phone tower for each placed call.� The second is social connectedness based on neighbors in common, which they measured in a variety of ways including the Jaccard coefficient, Katz, common neighbors, and Adamic-Adar.� The third is the number of calls placed between two users.� They found all these co-location measures provided good link prediction, defined as detecting node pairs that will communicate with each other in the future.� Additionally, they found that the combination of mobility measures with pre-existing network-closeness measures can improve link prediction in a supervised classification.
�
2.2.3 Internet social activity
Increasingly, social scientists are studying Internet social media.� (Pham et al., 2011) provides a model to measure co-occurrence in space and time.� Their geospatial social model reflects the value of co-occurrence taking into account its spread over multiple locations.� For instance, if two pairs of users each have six co-occurrence events, but the first pair has all six co-occurrences in the same place, whereas the second has them in six different locations, the second pair has a stronger social connection.� They create a master vector that reflects the maximum value of co-occurrence a pair of users can have in a chosen space-time grid.� They measure the strength of connection between two users as the inner product of the co-occurrence vector and the master vector.�
These ideas are further explored in (Pham et al., 2013), which uses data from a social-media application called GOWALA that allows users to share their location via �check-ins.� Their entropy-based model predicts the strength of social connections as a function of both the diversity of co-occurrence and the weighted frequency of co-occurrence.� Weighted frequency is designed to give greater significance to co-occurrence in uncommon space and time.�
(Crandall et al., 2010) studied the social-media application Flickr that allows users to share photos and video.� They used the geographical-tag feature of photos posted on Flickr, and if two users posted photos of the same place at relatively the same time, they suspected a social connection.� The reported connections on Flickr, in the form of friends and family lists, served as confirmation of a suspected social connection.� An important result of their research was that as the area where co-occurrence is observed decreases, the probability of social connection does not always improve.� They did find like (Pham et al., 2013) that co-occurrence in a diverse set of locations was a stronger indicator of friendship.�
(Lauw et al., 2005) discussed the size of spatial and temporal cells and proposed formulas for the precision of spatial and temporal co-occurrences.� Co-occurrences during unusual time periods and co-occurrences in rarer locales provide greater precision, translating to better connection scores.� They used webpage requests from computer users on their university campus and hypothesized that the requests for the same page indicated shared interests or collaboration.� They used demographic similarity to affirm or reject such connections; co-occurrence events were cross-referenced with demographic data of the two users including academic major, year of graduation, and status (graduate, undergraduate, etc.).� Their approach is a test of homophily, the idea that people with similar attributes and interests tend to associate with one another.
3. Methods
To test co-occurrence in the maritime domain, we used two datasets.� The first dataset was 5.96 million historical Automatic Identification System (AIS) records which make use of on-board vessel transponders that periodically report position and time.� This dataset covered the South China Sea from November 2014 through March 2016.� The second dataset consisted of vessel-ownership records.� The AIS data were used to find co-occurrences among vessels, and the ownership records served as a ground truth to confirm whether vessels were affiliated.
3.1. Finding co-occurrences
Co-occurrence of vessels differ with the situation.� For instance, vessels that collaborate on oceanographic or geologic engineering projects at sea show different patterns of co-occurrence than vessels that have competing interests in a certain area.� A group of shrimp boats may each have different owners, travel from the same port or nearby ports, and visit the same areas at different times without being in close proximity.� On the other hand, vessels collaborating to build a canal may be of different types, travel from different ports, but appear together in close proximity.� Three experiments were used to explore maritime co-occurrence.�
In the first experiment, randomly selected vessels served as a control group for identifying relationships. �There were five iterations of randomly selected vessels that yielded between 127�175 different vessels in each of the five groups, though the same vessels could appear in multiple groups.� The motivation for selecting five separate iterations was to control for differences among the vessels.� Having a mix of different types of vessels appearing in different geographic areas provided a good variety.�
In the second experiment, two locations of interest were used.� Maritime domain awareness usually starts with either locations of interest or vessels of interest.� A location of interest designation could be used if an area has contentious sovereignty claims like islands in the South China Sea, if it is regulated for activities like commercial fishing, or is a major chokepoint that is vulnerable to piracy.� The first location of interest we used was at latitude 22.333 and longitude 114.120 in the vicinity of Hong Kong, and it was selected because it provided a coastal area with a high density of maritime traffic.� The area for inclusion was a 7.79 KM radius around the center point (discussed further in section 3.5).� The second location of interest was a cluster of six islands in the South China Sea that are part of the Spratly Island chain.� They are Itu Aba Island, Thitu Island, West York Island, Spratly Island, Fiery Cross Reef, and Mischief Reef.� Chinese vessels have regularly conducted reef enhancement activities there.� The islands were considered as one location of interest due to their small size and close proximity; Table 1 lists their data.� The traffic density and makeup are very different for the two locations of interest, which allowed us to test differences in the way that co-occurrence is manifested.�
The third experiment used a set of vessels of interest.� For instance, one of the larger maritime companies in the world is China Ocean Shipping Company (COSCO).� The company claims ownership of 1114 vessels (COSCO, 2013).� As a logistics company, most of the COSCO fleet is transport vessels like bulk carriers, tankers, and container vessels, but it also has specialized vehicles including semi-submersibles, heavy-lifters, and multi-purpose vessels.� COSCO is a state-owned enterprise with upwards of 300 different subsidiaries, many of which take on the COSCO name in some capacity, e.g.� COSCO Pacific Ltd., or COSCO Shipping Lines.� Vessels owned by a conglomerate maritime company like COSCO provide an implicit maritime network, and its vessels could serve as vessels of interest.�
Table 1.� Location of interest�Spratly Island locations
|
Name |
Coordinates |
Decimal Degrees |
Area |
|
Itu Aba Island |
10�23′N 114�21′E |
10.3750, 114.3699 |
46 |
|
Thitu Island |
11�03′N 114�17′E |
11.0521, 114.2904 |
37 |
|
West York Island |
11�05′N 115�01′E |
11.0780, 115.0022 |
18.6 |
|
Spratly Island |
08�38′N 111�55′E |
8.6423, 111.9243 |
13 |
|
Fiery Cross Reef |
9�32′57″N 112�53′21″E |
9.5482, 112.889167 |
Unknown |
|
Mischief Reef |
9�55′N 115�32′E |
9.9013, 115.5354 |
Unknown |
3.2. Confirming social connection
After co-occurrences were identified among the vessels in each of the experiments, vessel ownership records were used to confirm whether the vessels were affiliated.� We assumed that a pair of vessels were affiliated if the same company owned them.� There are other forms of affiliation among vessels; for example, vessels owned by a company that is a subsidiary of another, and vessels owned by different companies under the same contractual agreement.� Nonetheless, if co-occurrence can be proven useful for identifying vessel affiliation, then it can be applied to other situations in which ownership records are unavailable or inadequate to confirm affiliation.
�����������
3.3.The data sources used
Our experiments used ship data from two sources, the Automatic Identification System (AIS) database and the Tokyo Memorandum of Understanding (Tokyo MOU, 2017).� The AIS data were acquired from the Naval Research Laboratory.� Our sample covered a period between November 2014 and March 2016 and an area between Latitudes 4�40 and Longitudes 107�126.� This includes much of the Yellow Sea, East China Sea, South China Sea, and part of the Philippine Sea.� This area is one of the busier maritime zones, and includes a significant amount of coastline as well as open ocean areas, economic resources (minerals, petroleum, and fish stocks), and other features of special interest such as reefs and islands. �
AIS is a transponder-based system for the maritime domain.� Information generated from shipboard devices like GPS receivers and gyrocompasses is transmitted via an onboard VHF transceiver to coastal stations and AIS-equipped satellites.� AIS data includes the Maritime Mobile Service Identity �number (MMSI), the IMO which is a permanent seven-digit number associated with the ship hull, the name of the vessel, the call sign, the type of ship, the type of cargo, the ship dimensions, the draught, the destination, the estimated time of arrival, the current location, the time of the data in coordinated universal time (UTC) seconds, the current heading, the course, the speed, and the navigation status (underway, at anchor, etc.).�
The ability of vessels to transmit AIS data and access the data from other nearby vessels helps in collision avoidance, its primary purpose.� AIS can also be used to aid in navigation, track and monitor fleets, assist in maritime security, and help reveal vessel-network affiliations.� Currently, only vessels at least 300 gross tons and all passenger vessels are required to be equipped with AIS transponders (International Maritime Organization, 2017).� Smaller vessels and those of special types have different requirements depending upon the waters in which they operate.� �Figure 1 shows the vessel lengths in the data showing that the listed vessels are predominantly over 50ft. long.
Figure 1: Ship-length histogram in our AIS data sample.
Our AIS sample contained 5,976,086 records.� Of these, 16% (983,912) had missing or invalid IMO numbers.� The two datasets, AIS and MOU, only shared vessel IMO numbers, so it was only by these numbers that they could be joined.� The AIS data also contained some apparently invalid ship names (e.g.� �K9s(psid* 4u-pua@u K�), vessel speeds, and lengths.� For example, some ships had lengths of zero, and some had recorded speeds well over 80 knots, an unachievable speed with existing technology.�
Because AIS records do not have vessel-ownership information, company data was acquired via web-scraping the Tokyo Memorandum of Understanding (MOU).� Web scraping presented challenges for acquiring enough usable information.� Queries of the Tokyo MOU were limited to 500 per 12-hour period, required a single vessel identifier like an International Maritime Organization (IMO) number, and could only be acquired one at a time.� This made the process slow and cumbersome.
�
3.4. Merging and clustering ownership data
Vessel IMO numbers provided by AIS were used to obtain company-related information of the company name, company IMO number, company address, and company phone number.� There can be inconsistencies in that data such as typographical errors, spelling errors, and differences in capitalization and punctuation.� Company information is the key data we use for establishing association between vessels, so our methods needed to be error-tolerant.� One method we used was clustering data company names, addresses, and phone numbers using the open-source software OpenRefine.� Techniques for clustering included the key-collision methods Fingerprint, N-Gram, Methaphone3, and Cologne-phonetic.� Nearest-neighbor methods were also explored including the edit distance (e.g., the Levenshtein distance) and prediction by partial matching.
Unfortunately, finding useful suggestions via such methods was rare.� For company names, the methods would often match common words among maritime companies such as shipping, maritime, marine, management, ltd, co, bulk, transport, group, carrier, Asia, and Pacific.� For instance, �ISM Ship Management Pte Ltd� was matched to �Thome Ship Management Pte Ltd�.� Suggested clusters included addresses that were different only in postal code as �Kifisia, 145 63 Athens, Greece� and �Kifisia, 145 62 Athens, Greece� although having quite different company names.� Other similarities found addresses located on different floors of the same building, or matches on addresses missing building identifications.� While such similarities can suggest affiliation, they are inconclusive as it is not uncommon to find unrelated companies in the same industry physically located nearby.
We found the company name to be the most useful clue for clustering records.� It is common for larger companies to have multiple locations, so �Misuga Kaiun (HK) Ltd� and �Misuga Kaiun Co Ltd� should match.� The likelihood that different companies in the same industry in the same region of the world have the same name is small.� There were also a few company pairs with the same phone number, sometimes with differences in the spacing between digits that needed to be eliminated.� Match strength was increased if companies shared information across more than one attribute, such as keywords in the company name and locations within the same region.�
The appearance of rare keywords and key phrases between company names was also deemed sufficient to indicate association.� For example, �V Ships France SAS� and �V Ships Ship Management (India) Pvt Ltd� were matched because they share �V Ships� in their name.� All such pairs found were verified to belong to parent companies.� Unfortunately, the complete holdings of conglomerate maritime companies of interest are not published, and some companies observed were private and did not disclose all their holdings.
3.5. Representing co-occurrences
Co-occurrence could be interpreted as either two or more vessels in nearly the same place at nearly the same time.� Alternatively, it could mean appearing at the same location at very different times, which would make sense if a location is isolated and two or more entities appearing there suggest affiliation.� Co-occurrence could also mean two occurrences in a narrow time period in a large isolated area. �
In the maritime domain, large vessels do not appear close together in the same way that people or animals do.� The geographic expanse of an operating area does affect a vessel�s distance from others; high-density areas like maritime chokepoints and ports force a closer proximity.� Taking everything into account, this work set the spatial and temporal thresholds for characterizing co-occurrence events at 7.79 km (0.05 decimal degrees) distance within 24 hours.� Figure 2 shows this distance from the center of Itu Aba island, itself roughly the size of a small runway.� The Haversine formula was used to compare two locations (in latitude and longitude) to get a great-circle difference between the two points in kilometers.� The formula corrects for the decrease in distance between longitude degrees with latitude and the curvature of the earth.�
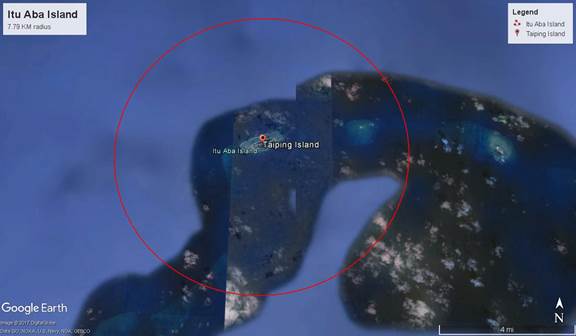
Figure 2: Itu Aba Island and 7.79 km radius (produced by Google Earth).
Another co-occurrence factor is how many events are shared between pairs of vessels.� We define a different co-occurrence as when the distance between the two co-occurrences is more than our spatial threshold of 7.79 km.� Counting different co-occurrences allows for more fine-grained analysis about co-occurrences among vessels.� As mentioned, co-occurrences among pairs in more than one place indicate a greater likelihood of affiliation.
�
We also counted the total number of co-occurrences between pairs of vessels.� Like the count of different locations, this provides an additional clue to a relationship between them.� We count both the number of different locations in which they appear together and the total number of times this occurred.�
4. Results
Each of the three experiments (random vessels, selected locations of interest, and selected vessels of interest) identified co-occurrences among the vessels, which were then compared to vessel-ownership data.� If the pairs� owners were the same, the pair was considered correct.� Correct identification was rare in all three experiments.� The random pairs had 1% with the same owner, the Hong Kong locations-of-interest pairs had 8%, and the Spratly locations-of-interest pairs had 9%.� The COSCO vessels-of-interest data showed a much higher percentage of 71%, but that was expected based on the data selection criteria.� In addition, for each of the three kinds of data, most pairs had only a single co-occurrence; that is, most pairs of vessels appeared together in only one location and on one occasion.
4.1. Experiment 1: Randomly selected vessels
With only the randomly selected vessels, there was a Pearson correlation coefficient of 0.68 between the number of places a pair of vessels reported together and the number of total times the pair had reported together, a good indicator of correlation between these two measures.� The many points at that minimum say that pairs of vessels that co-occur tend to do so at different locations and times.� To give a sense of the data, Figure 3 presents a histogram of the locations.� The x-axis is the number of locations a pair of vessels reported together, and the y-axis is the normalized count. �We did five runs and results had much similarity.� The five iterations showed approximately 50% of the pairs had only one co-occurrence.� The numbers drop off significantly after that, with 20% or less having two co-occurrences.�
�
Figure 3: Number-of-locations histogram (random subset of the data).
To see if greater co-occurrence indicates greater likelihood of affiliation, we plotted receiver-operating-characteristic (ROC) curves measuring the true positive rate against the false positive rate.� A true positive was defined as a pair of vessels that exceeded the co-occurrence threshold when the pair were confirmed to be affiliated; a false positive was a pair that exceeded the threshold but were not affiliated.� We constructed ROC curves by varying the required threshold in number of co-occurrences (Figure 4).� The upward bulge of the curves says that the number of co-occurrences a pair of vessels has an at least better than random chance at predicting affiliation.�
Figure 4: ROC total co-occurrences (random subset of the data).
4.2. Experiment 2: Locations of interest
Figure 5 plots the number of co-occurrences against the number of locations for the Hong Kong sample, and Figure 6 for the Spratly Islands sample.� The Pearson correlation coefficient was 0.8 for the Hong Kong data and 0.07 for the Spratly Island data, so they were quite different.�
Figure 5: Co-occurrence scatter plot for Hong Kong data.
�
Figure 6: Co-occurrence scatter plot for Spratly data.
Note that near Hong Kong the number of locations is strongly related to the number of co-occurrences, but not near the Spratly Islands.� The Hong Kong data sample had 213 different vessels whereas the Spratly Islands sample had 65, but it seems unlikely that this affected the results.� We conclude that the demographics and behaviors of vessels in these areas are different.� A few pairs appeared together in only one place on over 100 occasions, which caused the low correlation score.� One would expect a pair of vessels that only have a single unique location to have a much lower total number of co-occurrences.� Because these small islands are isolated, perhaps the vessels have fewer places to go.� These islands are being enhanced in various ways, so perhaps the vessels are working together in a small area over long periods of time as in a dredging operation.�
Figure 7 and Figure 8 show histograms of the values for the number of co-occurrences for pairs of vessels in the Hong Kong and Spratly Islands data samples.� As we saw using randomly selected vessels, most pairs (80-90%) only co-occurred in one location.� In the Hong Kong data, nearly 80% of the pairs had only one co-occurrence; in the Spratly Islands data, it was 35%.�
Figure 7: Total co-occurrences histogram for the Hong Kong data.
Figure 8: Total co-occurrences histogram for the Spratly data.
While sample sizes are small, it appears that there is some difference in the reporting behavior of vessels at different locations.� In densely populated areas like the port of Hong Kong, the results are more in line with the random data samples.� The higher number of co-occurrence events provides a higher level of confidence that a pair of vessels are affiliated.� The Spratly Islands sample does not provide much confidence at all; data suggests only slightly better than random chance that a pair of vessels is affiliated.� This seems counterintuitive; the Spratly Islands are more isolated and higher numbers of co-occurrence in isolated areas would suggest a better chance of affiliation than high numbers of co-occurrence in areas that are densely populated.�
4.3. Experiment 3: Vessels of interest (VOI)
Experiments with vessels of interest examined the maritime conglomerate company COSCO specializing in bulk transportation.� Figure 9 is a scatter plot of the number of co-occurrences versus the number of locations for the 298 vessels in the sample.� The Pearson correlation coefficient between the number of locations a pair of vessels reports and the number of times a pair of vessels reports was 0.9.� Data showed that nearly 80% of the COSCO sample reports a co-occurrence in only one location and only on one occasion.� Most of the sample consisted of transport vessels, and such vessels do not have much reason to congregate or to loiter in an area like those in the Spratly sample.� Instead, the COSCO vessels appear to be intent on getting from one destination to the next as quickly as possible.
Figure 9: Co-occurrence scatter plot for COSCO vessels.
4.4. Notable associations
Table 2 shows three interesting pairs of vessels in the randomly selected vessels.� The random samples generally have higher amounts of co-occurrence events, both in unique locations and total number.� We suspect that certain vessels transmit their position with higher frequency, and random selections are more likely to grab these vessels.� Note the erroneous MMSI number �111111111� which could be either a mistake or deliberate spoofing.
Table 2.� Interesting Pairs (Random Samples)
|
MMSI 1 |
MMSI 2 |
Locations |
Total |
Affiliated |
Company 1 |
Company 2 |
|
111111111 |
548438100 |
25 |
367 |
0 |
LD Ports & Logistics Pte Ltd |
Cokaliong Shipping Lines Inc |
|
548042500 |
548025500 |
53 |
127 |
1 |
Solid Shipping Lines Corp |
Solid Shipping Lines Corp |
|
548856000 |
548293100 |
67 |
104 |
0 |
Transnational Uyeno Maritime Inc |
Magsaysay Ship Management Inc |
Table 3 shows three pairs of vessels from the Hong Kong sample.� The sample includes the pair that had the highest amount of unique locations of eight, and the pair that had the highest number of total co-occurrences of 56.� The company �Chu Kong High-Speed Ferry Co Ltd� appears in many of the pairs, and it is not surprising that ferries have the most co-occurrences in a densely populated area like Hong Kong.�
Table 3.� Interesting Pairs (Hong Kong)
|
MMSI 1 |
MMSI 2 |
Locations |
Total |
Affiliated |
Company 1 |
Company 2 |
|
477197300 |
477197200 |
6 |
56 |
1 |
Chu Kong High-Speed Ferry Co Ltd |
Chu Kong High-Speed Ferry Co Ltd |
|
477937500 |
477937400 |
8 |
46 |
1 |
Chu Kong High-Speed Ferry Co Ltd |
Chu Kong High-Speed Ferry Co Ltd |
|
477937400 |
477995253 |
2 |
23 |
0 |
Chu Kong High-Speed Ferry Co Ltd |
Callany Ltd |
Table 4 shows some interesting pairs of vessels from the Spratly Islands sample.� The top line is the pair of vessels that had the most co-occurrences at 112 and all at one location.� We could not determine their company affiliation.� Another observation is the high percentage of Chinese vessels in the Spratly sample, not surprising given that Chinese state-owned enterprises have been observed conducting reef and island enhancement in the area.�
Table 4.� Interesting Pairs (Spratly)
|
MMSI 1 |
MMSI 2 |
Locations |
Total |
Affiliated |
Company 1 |
Company 2 |
|
600013090 |
412222222 |
1 |
112 |
missing |
missing |
missing |
|
413021030 |
413070000 |
1 |
37 |
0 |
China Yantai Salvage |
Guangzhou Salvage Bureau of the Ministry of Communications PRC |
|
412687000 |
413100000 |
6 |
7 |
0 |
China Yantai Salvage |
Shenzhen Tonghai Offshore Engineering Co Ltd |
Table 5 shows three pairs from the COSCO sample.� Included are the pair that had the highest total number of co-occurrences of eight, and the pair with the highest amount of unique locations of seven.� There is a much smaller number of co-occurrences compared to the other samples since these appear to be transport vessels.� The first pair has two companies, which were considered affiliated due to �COSCO� in their names.� The second pair were not considered affiliated, though �Lianyungang Ocean Shipping Co� is a subsidiary of COSCO, because the relationship is too far distant.
Table 5.� Interesting Pairs (COSCO)
|
MMSI 1 |
MMSI 2 |
Locations |
Total |
Affiliated |
Company 1 |
Company 2 |
|
412342000 |
412376000 |
2 |
2 |
1 |
COSCO Bulk Carrier Co Ltd (COSCO BULK) |
Shenzhen COSCO LPG Shipping Co Ltd |
|
353801000 |
412313000 |
7 |
7 |
0 |
COSCO Bulk Carrier Co Ltd (COSCO BULK) |
Lianyungang Ocean Shipping Co |
|
412277000 |
412148000 |
6 |
8 |
0 |
Seaspan Ship Management Ltd |
Shanghai Ocean Shipping Co Ltd |
4.5. Setting a distance threshold based on context
Different areas of the ocean have widely different congestion.� The left picture in Figure 10 plots the average distance of the nearest vessel in a period of one hour for each vessel in our data.� The span of red to blue indicates the average nearest distance in each bin, with red being 0.0 latitude degrees and blue being 1.0 latitude degrees; 1.0 was the maximum allowed.� Bins were for 0.1 degrees in width for both latitude and longitude.� There are clear congregations at 22N114E (Hong Kong) and 10N114E (Itu Aba in the Spratly Islands).� The wide variation suggests that the co-occurrence distance threshold needs to be proportional to the average distance of the nearest vessel in that region for co-occurrence to be most meaningful.� For comparison, the right picture in Figure 10 shows the logarithm of the vessel counts in the same bins for the same periods.� Both figures show the major shipping lanes, but the right figure does not show as clearly the co-occurrences of vessels in Hong Kong and the Spratly Islands.� This supports the idea that co-occurrence is a different phenomenon than congestion.
Figure 10: Nearest ship distance within one hour for our study area (left) and logarithm of counts within one hour (right).
Another way to analyze the same data is to calculate the
degree of anomaly of the minimum-distance values for a latitude-longitude bin.�
Expected random values were calculated by experiments with placing random points
inside a square.� From these experiments we got a least-squares fit of ![]() �for
the average minimum distance between points in the square.� Taking the ratio of
this to the observed minimum distance resulted in Figure 11.� The red dots are
the places where the minimum distance is significantly less than expected with
the observed number of ships in the bin, and those should be the locations of
highest interest for mission planning.
�for
the average minimum distance between points in the square.� Taking the ratio of
this to the observed minimum distance resulted in Figure 11.� The red dots are
the places where the minimum distance is significantly less than expected with
the observed number of ships in the bin, and those should be the locations of
highest interest for mission planning.
Figure 11: Degree of anomaly of the average minimum distance between ships in a bin (red is ships very close).
5. Conclusions
Understanding co-occurrences in the oceans can enable better planning of naval operations.� Since co-occurrences are relatively rare events, they deserve attention and further investigation.� While they may be accidental or routine cooperation, they become more interesting when the ship identities are interesting themselves.� Co-occurrences can be detected by long-term surveillance and their information can be forwarded to all units.
Our data analysis suggests several additional conclusions:
� As observed, AIS vessel data may not always be available or accurate.� It also lacks full ownership information so it needs to be augmented with another data source when used for planning operations.� When data is missing as in Table 4, co-occurrence may prove a useful means of suggesting associations.
� An obstacle in this research was establishing �ground truth� about vessel affiliation.� We attempted to establish it via ownership records but this ignores other ways in which vessels could be affiliated such as relationships of managers, operators, and maintainers.� Large companies could also have subsidiary companies which could be affiliates, and there may be relationships between stakeholders not explicitly recorded in any documentation.� The owners or operators of vessels may also be private companies which are not required to publicly disclose their affiliations.�
� An important finding has been that co-occurrence among vessels does not manifest uniformly.� In the COSCO data sample of mostly transport vessels, we saw a different co-occurrence trend than a data sample composed of a random group of vessels.� A fleet of bulk carrier vessels likely travels from one port to the next without accompanying vessels, whereas a group of logistics vessels collaborating on a dredging project have reason to cluster in remote areas.� The nature and extent of differences in co-occurrence trends requires more study, especially the co-occurrence rates atypical of a category of data.
� It would be useful to study additional vessels-of-interest categories like fishing vessels, because co-occurrence trends may be different based on our experiments so far.� It would also be useful to look at vessels of a different kind of known maritime network.
Acknowledgements
This work was supported by the Naval Research Program at the Naval Postgraduate School as NRP topics FY17-N086-A and FY17-N185-B.� The views expressed are those of the authors and do not represent the U.S. Government.
References
S. Borgatti, M. Everett, and J. Johnson, Analyzing Social Networks. Thousand Oaks, CA: Sage Publications, 2018.
China COSCO Shipping Corporation Limited, �Group profile�.� Accessed November 7, 2017.� [Online].� Available: http://en.coscocs.com/col/col6918/index.html.
D.� J.� Crandall, L.� Backstrom, D.� Cosley, S.� Suri, D. Huttenlocher, and J.� Kleinberg, �Inferring social ties from geographic coincidences,� in Proceedings of the National Academy of Sciences of the United States of America, 2010.� [Online].� doi: 10.1073/pnas.1006155107.
K.� Cutlip, �Spoofing: One Identity Shared by Multiple Vessels,� Global Fishing Watch, July 25, 2016.� [Online].� Available: http://blog.globalfishingwatch.org/2016/07/spoofing-one-identity-shared-by-multiple-vessels/.
N.� Eagle, and A.S.� Pentland.� �Reality mining: sensing complex social systems.� Personal and ubiquitous computing, vol.� 10, no.� 4, pp.� 255-268, May 2006.� [Online].� doi: 10.1007/00779-005-0046-3.
N.� Eagle, A.S.� Pentland, and D.� Lazer.� �Inferring friendship network structure by using mobile phone data,� in Proceedings of the National Academy of Sciences of the United States, 2009.� [Online].� doi: 10.1073/pnas.0900282106.
International Maritime Organization, �International Convention for the Safety of Life at Sea�.� Accessed November 7, 2017.� [Online].� Available: http://www.imo.org/en/About/Conventions/ListOfConventions/Pages/International-Convention-for-the-Safety-of-Life-at-Sea-(SOLAS),-1974.aspx.
J.� Krause, S.� Krause, R.� Arlinghaus, I.� Psorakis, S.� Roberts, C.� Rutz.� �Reality mining of animal social systems.� Trends in Ecology & Evolution, vol.� 28, no.� 9, pp.� 541-551, September 2013.� [Online].� doi: 10.1016/j.tree.2013.06.002.
P.� Last, C.� Bahlke, M.� Hering-Bertram, and L.� Linsen.� �Comprehensive analysis of automatic identification system (AIS) data in regard to vessel movement prediction,� Journal of Navigation, vol.� 67, no.� 5, pp.� 791�809, September 2014.� [Online].� doi: 10.1017/0373463314000253.
H.� Lauw, E.P.� Lim, H.� Pang, T.T.� Tan.� �Social network discovery by mining spatio-temporal events,� Computational & Mathematical Organization Theory, vol.� 11, no.� 2, pp.� 97-118, July 2005.� [Online].� doi: 10.1007/10588-005-3939-9.
H.� Pham, L.� Hu, and C.� Shahabi.� �Towards integrating real-world spatiotemporal data with social networks,� in Proceedings of the 19th ACM SIGSPATIAL International Conference on Advances in Geographic Information Systems, 2011.� [Online].� doi: 10.1145/2093973.2094046.
H.� Pham, C.� Shahabi, and Y.� Liu.� �EBM: an entropy-based model to infer social strength from spatiotemporal data,� in Proceedings of the 2013 ACM SIGMOD International Conference on Management of Data, 2013.� [Online].� doi: 10.1145/2463676.2465301.
I.� Psorakis, et al. �Inferring social structure from temporal data.� Behavioral Ecology and Sociobiology, vol.� 69, no.� 5, pp.� 857-866, May 2015.� [Online].� doi: 10.1007/00265-015-1906-0.
C. Ray, A. Grancher, R. Thibaud, L. Etienne, �Spatio-temporal rule-based analysis of maritime traffic,� in Conference on Ocean & Coastal Observation, 2013, pp.� 171�178.
Tokyo MOU, �PSC Database�.� Accessed August 20, 2017.� [Online].� Available: http://www.tokyo-mou.org/inspections_detentions/psc_database.php.
United Nations Conference on Trade and Development (UNCTD), �Review of Maritime Transport 2015.� Accessed November 7, 2017.� [Online].� Available: http://unctad.org/en/pages/PublicationWebflyer.aspx?publicationid=1374.
T. Wallace and F. Mesko, The Odessa Network: Mapping Facilitators of Russian and Ukrainian Arms Transfers.� C4IDS, retrieved from http://media.wix.com/ugd/ e16b55_bf858d0eea7a1726153452fbc09e70f1.pdf on May 11, 2018.
D.� Wang, D.� Pedreschi, C.� Song, F.� Giannotti, A.� Barab�si.� �Human mobility, social ties, and link prediction,� in Proceedings of the 17th ACM SIGKDD International Conference on Knowledge Discovery and Data Mining, 2011.� [Online].� doi: 10.1145/2020408.2020581.