Predicting Success in Training of Navy Aviators[AB1] 

Neil C. Rowe[AB2] 


Arijit Das

U.S. Naval Postgraduate School[AB3] 


U.S. Naval Postgraduate

School

[AB5] 

adas@nps.edu[AB6] 

Abstract[AB7] 

This project investigated patterns in the training data of U.S. Navy aviators in an attempt to predict their success in training.� We assembled a database from many sources of training data.� This database covered 18,596 pilot and Naval Flight Officer candidates through their pretesting, classroom instruction, training in generic aircraft, and training in specialized aircraft.� This data was hard to organize because it had incompatible formats and missing data.�� After standardizing the formats and fixing errors in the data, and aggregating sparse training records to a smaller set of average scores, we had 301 features for the candidates.� We then correlated their features using both numeric-correlation and nonnumeric-association (class-characterization) methods.� We identified 38 measures of success in the program, and particularly focused on correlations involving those.� We did confirm some early indicators of success and failure in the program that had not been noticed before.� We conclude that the Navy is doing a good job of identifying candidates likely to be successful, but additional factors should be considered.

This paper appeared in the Proceedings of the International Command and Control Research and Technology Symposium 2021.


1           Introduction and Previous Work

We investigated methods of predicting aviator training performance from earlier data on them.� The goal was to test features and combinations of them that were most helpful in guiding the Navy on investments in training of pilots and flight officers.

Military training assessment has many difficulties due to the expense of staging realistic exercises and the rarity of exceptional events for which warfighters must be ready (Salas, Milham, and Bowers, 2003; Schnell, Keller, and Poolman, 2008).� Skills decay is an important issue for this kind of training (Schendel and Hagman, 1991; Foggliatto and Anzanello, 2011; Ebbatson et al, 2012).� It is thus important to thoroughly exploit existing data through data-mining techniques to get early warning of potential problems (Dubey, 2016; Huggins, 2018; Gombolay, Jensen, and Son, 2019).� An important subproblem is that of predicting future pilot performance, for which a variety of data-mining techniques have been tried (Kaplan, 1965; Hunger and Burke, 2009; McFarland, 2017).

Previous analysis of the Naval training data by the sponsor was regression analysis.� However, many attribute values were missing in this data, and regressions do not work well on incomplete data.� Our previous work (Rowe, 2012) explored some more robust approaches.� It examined records of carrier landings as graded by Landing Signal Officers.� We could model the rate at which landing success and quality increased with experience, and we could correlate phrases in the comments on the landings with the degree of eventual candidate success.

2           Analysis Setup

2.1         Simplifying the Data

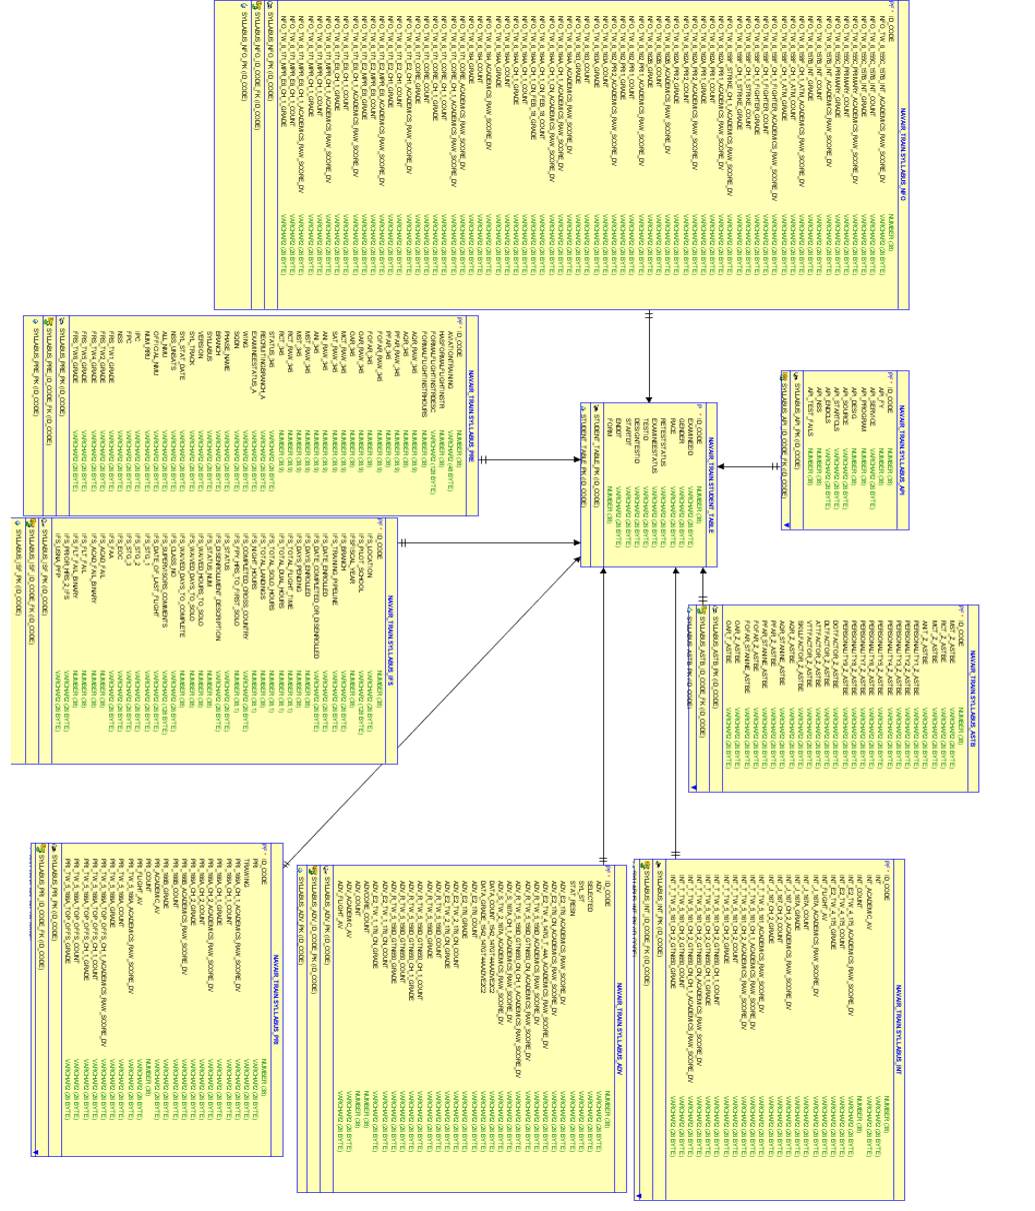
More details are in (Rowe and Das, 2020).� The sponsor sent us data in 143 Excel tables concerning U.S. Navy training performance by 18,596 training candidates.� We first converted the tables into CSV (comma-separated-value) files to make them easier to manipulate with programs.� The main tables were:

       The ASTB_IFS_API_PRI table (116 attributes) which reports data from early in training.

       The �Cumulative_All_Students_2012-2019� table (18 attributes) giving basic information about trainee pilots such as their air wing and curricula.

       The API_DATA table (7 attributes) which appears to cover additional scores to the preceding.

       �Academic� tables (51 files) reporting test scores on written tests in training after API instruction.� These we averaged for each candidate as explained in section 2.3.

       Flight-performance tables (73 files) by the aviator candidates.� These were averaged for each candidate as explained in section 2.3.

       Tables we created of summary information for the number of nonnull records for each phase and the average grades for a candidate over all grades in a phase.� Phases are explained in section 3.1.

A traditional database design would separate the tables and join them on their primary keys, the ID codes, as described in section 4.� However, pilot trainees were few enough, with 18,596 explicit pilot ID codes, that it was simpler and more efficient to do the joins in advance, and store a single flat file in main memory for analysis.� When we did this, the flat file was 301 attributes and 46.3 megabytes, a size that will not require much paging when stored in main memory since processing generally can operate on one candidate at a time.

Joins required care because much data was missing, a typical problem with military training records (Ambriz, 2017).� Some tests are not used in some curricula; some candidates are authorized to skip certain tests; some candidates drop out of the program and lack data for the later stages of training; and the data we could obtain was incomplete.� For these reasons, it was important to do �outer joins� rather than the traditional �inner joins� to connect tables, meaning that unmatched values in one table were represented by null values for their attributes in the join.

2.2         Data cleanup

The sponsor sent us data of many types.� Some was numeric like traditional test scores; some was numeric in a limited range, such as grades of 1, 2, 3, 4, or 5 on flight tests; and some of it was nonnumeric, such as candidate race, the kind of previous flight training they had, and whether they had been exempted from a particular evaluation.� Pilot names and other personally identifiable information were excluded.

Null values (blanks) occurred for measurements and features that did not apply to particular candidates, such as tests not taken in their curriculum.� Null values were inconsistently represented; they were inferred for the empty string, a string consisting of a single space, �N/A�, �#N/A�, �NONE�, and �NULL�.� These were replaced by the string �NULL� to regularize them.� 4804 null values for candidate ID codes occurred in the early training records for years from 2000 to 2010; they were replaced with consecutive negative numbers since the rest of their rows contained significant information.� Null values for numeric attributes generally meant missing values, so we excluded them from averages.� Nulls for nonnumeric attributes were generally important, such as a null for the type of previous flight training which meant the candidate had no previous flight training.

We needed to regularize other inconsistent formats.� For instance, some grades were 0 and 1 and others were Y and N for the same test.� Most training scores were the integers 0 to 100, but some were over 10000 and were changed to 100 to avoid distorting averages.� We also converted some nonnumeric values to numeric values when it appeared reasonable and helpful for analysis.� For instance, candidate course status was rated as �Complete�, �Pass�, �Incomplete�, �Conditional Pass�, and �Pass�; to get averages, we converted the first two to numeric value 1.0, the next two to 0.5, and the last to 0.0.� Dates were converted to epoch time (seconds since January 1, 1970 at midnight) to make them easier to compare.

2.3         Consolidating Flight Test and Academic Data

The main challenge in data setup were the many results of specialized flight tests and academics (124 in all) in the later stages of training, many of which had multiple rows for the same pilot and many nulls in the flight tests.� Our study of the tables indicated they could be appended horizontally in two circumstances.� First, some tables were labeled �v2� which meant they were the second half of another table that exceeded the Excel size limit, so we combined those in averages.� Second, some tables covered the same skills for different training units, so we combined those in averages.� However, in seven cases of table pairs for flight tests satisfying our criteria, the number of attributes differed between the pair.� We found this meant that some tests were not administered to the candidates listed in one table, so we added attributes of nulls to that table to permit combining.

We aggregated the sparse data of the remaining flight-test tables into fewer attributes since there were so many nulls.� We normalized the grades by dividing them by the corresponding level-of-difficulty (MIF) values, then averaged them for each candidate for a particular skill.� We then took the average for each candidate over all skills on which they were tested in a curriculum for both flight tests and academics.� This meant one average grade for each candidate and curriculum they took, and it reduced the number of such tables to two, one for flight tests and one for academics.� This averaging prevents correlating individual flight-skills grades; however, the alternative database implementation in section 4 does allow such queries.

3           Results and Analysis

3.1         Correlating Pilot Features

Our analysis used programs we wrote in the Python programming language.� Python is not subject to the size limits of Excel, and it could process the files quickly once converted to comma-delimited text format (CSV).� We used the Numpy package for linear algebra.� Setup of the data took a few minutes, and the correlations to be described took a few hours on a workstation.

As mentioned, the joined data had 301 attributes and 18,596 rows representing aviator candidates.� (The full descriptions of attributes are in [11].)� To determine the predictive ability of attributes, we could run regressions, but many numbers were missing.� Furthermore, regressions can be misled when too many variables are included, since the weaker factors may interfere with the calculation of the stronger factors.� Thus we focused first on comparing pairs of attributes to find those that had statistically significant correlations.� Once these are found, regressions can be done using only the statistically justified pairs.

Two important issues remain.� First, attributes are generally acquired in a specific order, and we want to predict later data from earlier data.� We identified 11 training phases.� PRE represents initial data about the candidate before any training such as their previous flight experience, their grades in previous academic work, their gender, and their race.� ASTB (Aviation Selection Test Battery) represents initial testing, IFS (Initial Flight Screening) represents initial flight school, API (Aviation Preflight Indoctrination) represents academic work on basic aviation concepts, PRI (Primary Flight Training) represents the first phase of flight experience in designated aircraft, INT (Intermediate Flight Training) represents the second phase, ADV (Advanced Flight Training) represents the third phase, and FRS (Fleet Replacement Squadron) represents the graduate program.� PRI1 represents the first part of PRI, PRI2 represents the second part, and ADVCORE represents the first part of ADV.� Candidates increasingly differ in their training as they get more specialized training at the later stages, but still follow the same basic pattern above.� The Naval Flight Officers in particular have many later courses different from those of the pilots.

The sequences of training phases were:

       For SNA (aviator) candidates: PRE � ASTB � IFS � API � PRI � INT � ADV � FRS

       For SNFO (flight officer) candidates: PRE � ASTB � IFS � API � PRI1 � PRI2 -- INT � ADVCORE -- ADV � FRS

To decide only in which direction to predict values, it is sufficient to use a single sequence where not all phases are required for a candidate:

       PRE � ASTB � IFS � API � PRI � PRI1 -- PRI2 -- INT � ADVCORE -- ADV � FRS

Each attribute of the data is associated with a particular phase.� The file �Key for ATSB_IFS_API.xlsx� provided phase information on the 116 attributes of� ASTB_IFS_API_PRI_v2.1, and the names of the Academic Test and Maneuver Test files themselves indicated their phases.� Phase names for the other attributes were determined from background research.�

Another issue was that some attributes were numeric and others were categorical like graduation status.� Though most were numeric, some nonnumeric ones are important such as those about success of training.� This meant we implemented four cases in correlating attributes:

       Two numeric attributes, such as two test scores: We did a Pearson correlation and a linear regression from the earlier attribute to the later attribute.� The correlation was a measure of statistical significance.

       An earlier categorical attribute and a later numeric attribute: We compared the mean of the numeric attribute for each categorical value in the categorical attribute.� Degree of significance was the number of standard deviations from overall mean of the later attribute.

       An earlier numeric attribute and a later categorical attribute: We use the same method as the preceding in the reverse direction.

       Two categorical attributes: We measured the statistical significance as the number of standard deviations of the frequency of the occurrence of the pair of values from the expected frequency of a Poisson distribution based on the occurrence rates of the values individuals.� Specifically, if the value in the first attribute occurs �times out of �and the value in the second attribute occurs �times out of , and the pair of values occurred K times in the data, the number of standard deviations from the expected frequency is������ �.

Rows with nulls for numeric attributes being correlated were ignored, but nulls for nonnumeric attributes were useful and their rows retained, such as nulls for final grades indicating a candidate had dropped out.

We did not correlate some attributes we considered uninteresting.�

       Columns having only one value since we cannot conclude anything from them.

       Nonnumeric attributes having more than 100 values since these were unlikely to show statistically significant trends.�

       ID code number.� This occurred several times in the join table because we joined on it several times.

       Raw test scores when normalized scores were available.

       Redundant data on sex and gender.�

3.2         Binary Correlations with Candidate Success

We were primarily tasked to find attributes indicating future success or failure of a candidate.� With the help of the sponsor, we identified 38 possibilities, both numeric and categorical, following capitalization conventions:

       RetestStatus and ExamineeStatus attributes of the ATSB-phase data

       IFS_DISENROLLMENT_DESCRIPTION, IFS_STATUS_NUM, and IFS_USNA_PFP in the ASTB_IFS_API_PRI table, representing IFS-phase test status

       IFS_ACAD_FAIL and IFS_FLT_FAIL in the ASTB_IFS_API_PRI table, representing IFS-phase test failures

       API_NSS and API_Test_FAILS in the ASTB_IFS_API_PRI table, representing API-phase test averages and failures

       Pri, Int, and Adv in the ASTB_IFS_API_PRI table, representing status of candidates in PRI (primary), INT (intermediate), and ADV (advanced) training

       NGCode in the ASTB_IFS_API_PRI table, representing early disenrollment

       Number of ASTB1-5 and Number of ASTBE tests in the ASTB_IFS_API_PRI table, two early tests

       SYL-ST (syllabus status) and STAT_RESN attributes in the Cumulative table, representing status of the student in their curriculum

       NSS_UNSATS, OFFICIAL_NMU, NUM_RRU, IPC, FPC, and NSS in the Cumulative table, representing grades

       FRS_TW1_Grade, FRS_TW2_Grade, FRS_TW3_Grade, FRS_TW4_Grade, FRS_TW5_Grade, and FRS_TW6_Grade from the FRS-phase data.

       FRS_TW6_Status from the FRS data, referring to the FRS-phase training.� We only had data for the training group TW6.

       Counts on the number of nonnull records for the candidate for each phase.� Unsuccessful candidates were missing data for the later phases, although incomplete records meant some earlier data was missing too.

       Average academic and flight-test grades for the PRI, INT, and ADV phases.

Table 1 summarizes significant correlations found for these attributes; more details are provided in [11].� Positive correlations for numeric attributes were considered those with a Pearson absolute value above 0.1; positive correlations with nonnumeric attributes were considered those with a threshold of significance of above 5.0.� These results respect the order of the phases.

3.3         Discussion of Binary Correlations

The reliability of the correlations with success in the program was hampered by the low rate of failure.� For instance, IFS_STATUS recorded 13,460 candidates who completed and 374 who were �disenrolled�; SYL_ST had 5369 who completed and 260 who were �attrited�.� ��Note that since correlations were only calculated on pairs of non-null numbers, correlations on later phases did not include candidates who attrited at earlier phases and who might have provided useful data.� Nonetheless, we did see some trends:

       There were some strong correlations of success with increasing dates, but these are likely spurious due to having more complete data for recent candidates.

       There were some strong correlations of success with number of flight hours. However, �Formal flight instruction hours� correlated negatively with several measures of final success.� It may be that weaker candidates are attrited, get more remedial instruction, or that formal flight instruction on different aircraft confuses candidates.

       Female gender and minority race showed more failures early in training but fewer later in training.

       Several ASTB test results correlated well with success in IFS, Primary, Intermediate, and FRS; we gather that the ASTB was designed to do this.� However, ASTB was not as helpful in predicting success in the Advanced training, by which time many additional skills have been learned.


Table 1: Possible measures of success of a candidate.

Success-related attribute

Phase

Possible nonnull values

Nonnull occurs

Positive corrs.

Negative corrs.


NGCode

PRE

12 strings

1761

0

0


RetestStatus

ASTB

Never, 30Days, 90Days, 180Days, Never1992, Resume

8540

5

0


ExamineeStatus

ASTB

None

None

0

0


Number of ASTB1-5

ASTB

Floating point

14477

3

7

Number of ASTBE

ASTB

Floating point

4564

3

7

IFS_STATUS

IFS

Complete, Disenroll, Closing

13844

3

0


IFS_STATUS_NUM

IFS

Numbers 0.0 to 1.0

13834

5

0


IFS_DISENROLLMENT_DESCRIPTION

IFS

String

5787

5

13


IFS_USNA_PFP

IFS

String

634

0

17


IFS_ACAD_FAIL

IFS

Number 0.0 to 1.0

13844

0

9


IFS_FLT_FAIL

IFS

Number 0.0 to 1.0

13844

7

5


API_NSS

API

Integer

17401

17

2


API_Test_FAILS

API

Integer

17446

8

8


Count of nonnull values for the API phase

API

Floating point

18596

6

7


Pri (status in training)

PRI

G, UI, NG, AT, TG, UA

14461

4

2


Count of nonnull values for the PRI phase

PRI

Floating point

18596

16

1


PRI academic average

PRI

Floating point

13555

17

4


PRI flight average

PRI

Floating point

10664

19

3


Int (status in training)

INT

G, AT, UI, NG, MA, J

5530

1

1


Count of nonnull values for the INT phase

INT

Floating point

18596

26

9


INT academic average

INT

Floating point

8153

22

4


INT flight average

INT

Floating point

3301

7

11


Count of nonnull values for the ADV phase

ADV

Floating point

18,596

29

10


ADV academic average

ADV

Floating point

9712

21

4


Adv (status in training)

ADV

G, AT, UI, NG, UU, TG, SQ, UIT

16005

1

1


ADV flight average

ADV

Floating point

4593

33

9


SYL_ST (syllabus status)

ADV

Complete, Active, Attrite

6292

5

2


STAT_RESN (reason for syllabus status)

ADV

20 strings

260

0

0


NSS_UNSATS

ADV

Number

3012

1

0


OFFICIAL_ NMU

ADV

Number

3012

1

0


NUM_RRU

ADV

Number

3012

1

0


IPC

ADV

Number

3012

0

0


FPC

ADV

Number

3012

3

0


NSS

ADV

Floating point

5221

1

4


Count of nonnull values for the FRS phase

FRS

Floating point

18,596

37

13


FRS_TW6_Grade

FRS

Number

1274

29

8


FRS_TW6_Status

FRS

Number 0.0 to 1.0

7682

36

7


       Several Primary, Intermediate and Advanced training grades correlated positively with both success in Advanced training and FRS.� We gather these are useful metrics that should be preserved.� However, some of the advanced-training grades correlated negatively with success, and these should be investigated further. Perhaps these grades represent �makeup� activities for candidates who have failed in other skills, or perhaps the training associated with those skills is counterproductive.

       Some of the strong correlations to phase counts may be due to policy rather than candidate aptitude, as when candidates are attrited if they fail to score sufficiently well on a metric or fail a benchmark too many times.� We are not familiar with Navy policy and cannot guess what the attrition conditions are.� However, being attrited in the next phase after a poor test score indicates aptitude rather than policy because a policy on that test score would have attrited them earlier.

3.4         Experiments with Learning of Regressions

We were tasked to apply machine learning to the analysis of the data.� Unfortunately, too much data was missing to do traditional regression analysis or neural networks on all the variables together.� So instead we used the machine-learning method of set covering to find good subsets of the data for linear regressions.� Given a single numeric target variable, it finds successively well-supported regressions with single variables, pairs of variables, triples of variables, and so on wherever there is enough data.� For a first test, we analyzed eight variables important in assessing overall performance of a candidate:

       Primary-training flight-test average

       Intermediate-training flight-test average

       Count of records for advanced training (done two ways)

       Advanced-training academic average

       Advanced-training flight-test average (done two ways)

       Count of records for fleet replacement squadron (done two ways)

       Grade for fleet replacement squadron

       Status for fleet replacement squadron

The best three-variable linear-regression fits to a fourth target variable that we found for at least 100 candidates are given in Table 2.� Fits to three important target variables were done on two sets of input variables, the most representative variables and the variables only available early in training (like the early ASTBE tests), to see how accurate early predictions can be.

Results were consistent with the correlations in section 3.2.� As could be expected, results on immediately previous evaluations were the best predictor of a training evaluation.� Nonetheless, several early ASTB, IFS, and API metrics correlated with performance in the later Advanced and FRS phases.


Table 2: The best three-element linear regressions found on key measures of success.

Target variable

Rows with data

Fit formula

Standard error

Primary-training flight-test average

4174

1.138*QRT_Z_ASTBE - 0.681*OAR_Z_ASTBE + 0.173*API_NSS + 86.728

12.6740

Intermediate-training flight-test average

629

-0.03058*QRT_Z_ASTBE + 0.02308*FOFAR_Z_ASTBE + 0.00173*PRI_ACAD_AV + 1.31788


0.004029

Count of records for advanced training

320

0.06860*PFAR_Z_ASTBE � 0.15179*IFS_ACAD_FAIL � 7.17588*INT_FLIGHT_AV + 10.01166

0.73199

Count of records for advanced training

2497

-0.2800*PFAR_Z_ASTBE + 0.0093*IFS_STG_3 � 0.0038*API_NSS + 2.6337

2.5365

Advanced-training academic average

2807

0.4754*AQR_Z_ASTBE � 0.4001*PFAR_Z_ASTBE + 0.1938*API_NSS + 84.9048

9.2882

Advanced-training flight-test average

1653

-0.0049*FOFAR_Z_ASTBE + 0.0009*IFS_ACAD_FAIL + 0.5529*PRI_FLIGHT_AV + 0.3937

0.001402

Advanced-training flight-test average

2884

-0.00617*IFS_TOTAL_ FLIGHT_TIME + 0.00084*IFS_STG_1 + 0.00250*API_NSS + 0.96262

0.004266

Fleet-replacement-squadron count

630

0.1277*MST_Z_ASTBE � 0.0984*MCT_Z_ASTBE � 2.5762*INT_FLIGHT_AV + 3.2898

0.5572

Fleet-replacement-squadron count

13295

-0.0777*IFS_TOTAL_ FLIGHT_TIME + 0.0195*IFS_STG_1 + 0.0205*IFS_STG_2 � 1.7869

0.8012

Fleet-replacement-squadron TW6 grade

62

2.240*API_Test_FAILS + 0.985*PRI_FLT_AV + 148.598*INT_FLIGHT_AV � 154.823

48.901

Fleet-replacement-squadron TW6 status

1548

0.00113*ANIT_Z_ASTBE � 0.00478*IFS_FAILS � 0.07188*ADV_FLIGHT_AV + 1.06710

0.000294


3.5         A Greedy algorithm for finding the best regression formulae

To improve the speed of finding good sets of variables for regressions, a greedy algorithm can assess one variable at a time, deciding whether to include it or not in the regression; that decision can also be based on the number of rows of data that have values for the variable, a key issue with our data.� Additive methods can build a regression model by successively adding the variable that improves the fit the most; subtractive methods can start with a complete regression model and successively remove variables that hurt the fit the most.� We preferred an additive approach because of the many missing data values.� Regressions do not make sense without sufficient data, so we did not attempt them when the number of data rows having nonnull data for the specified attributes was less than twice the number of attributes.� We also did not add attributes whose inclusion did not improve the fit by at least 0.1%.� Nonetheless, there were still many variable combinations to consider.


To test regressions between early indicators and later performance, we chose 33 attributes to focus on for finding good fits based on the adequacy of their data and their likely relation to the target attributes of section 3.2. We applied the greedy algorithm to pick subsets of these input variables, did linear regressions, and measured the standard error.� The best subsets are shown in Table 3.� It is clear that ASTB results matter more for primary training, less for intermediate training, and little for advanced training.� But the particular ASTB and personality-measure metrics that matter vary considerably with the different target variables.


Table 3: Best regression formulas found for later-phrase metrics based on early-phase metrics.

Number of candidates

Average error

Target variable number

Best regression formula found

4144

0.0096

291

0.0242*PFAR_Z_ASTBE + 0.0048*API_NSS + 0.0171*ANIT_Z_ASTBE + 0.0098*ATTFactor_Z_ASTBE + 0.0063*Personality5_Z_ASTBE + -0.0074*Personality6_Z_ASTBE + -0.0107*OAR_Z_ASTBE + -0.0136*Number of ASTBE + 0.0057*Personality3_Z_ASTBE + -0.0102*API_Test_FAILS + 1.0659 = PRI_FLIGHT_AV

624

0.0038

295

-0.0123*ANIT_Z_ASTBE + 0.014*DLTFactor_Z_ASTBE + -0.0055*ATTFactor_Z_ASTBE + 0.0111*Number of ASTBE + -0.0008*API_NSS + -0.0032*VTTFactor_Z_ASTBE + 0.0069*API_Test_FAILS + 1.181 = INT_FLIGHT_AV

2880

0.0042

299

0.0017*API_NSS + -0.0069*IFS_TOTAL_FLIGHT_TIME + 0.0008*IFS_EOC + 0.0008*IFS_STG_1 + -0.0093*API_Test_FAILS + 0.9477 = ADV_FLIGHT_AV

2476

0.2081

289

-0.0088*Number of ASTBE + 0.0053*API_NSS + 0.0011*IFS_EOC + 0.0302*ANIT_Z_ASTBE + -0.0707*API_Test_FAILS + -0.029*IFS_TOTAL_FLIGHT_TIME + -0.0457*IFS_ACAD_FAIL + 0.0196*SkillFactor_Z_ASTBE + 5.0012 = PRI_COUNT

2694

0.9148

293

-0.0331*IFS_TOTAL_FLIGHT_TIME + 0.1961*PFAR_Z_ASTBE + 0.0939*ANIT_Z_ASTBE + 0.0479*Personality2_Z_ASTBE + 0.0432*Personality8_Z_ASTBE + 0.039*ATTFactor_Z_ASTBE + 1.6159 = INT_COUNT

13844

2.1403

297

-0.0626*IFS_TOTAL_FLIGHT_TIME + 0.4278*IFS_FLT_FAIL + 2.7704 = ADV_COUNT

12668

0.8013

300

-0.0937*IFS_TOTAL_FLIGHT_TIME + 0.0063*API_NSS + -0.1424*IFS_ACAD_FAIL + 2.0684 = FRS_COUNT

1254

588.4

151

-0.828*IFS_STG_2 + 0.7108*IFS_FAA + 7.4391*IFS_ACAD_FAIL + 0.9847*IFS_TOTAL_FLIGHT_TIME + -0.1748*IFS_STG_3 + 33.4863 = FRS_TW6_Grade

5386

0.0003

152

0.0*IFS_EOC + -0.0021*API_Test_FAILS + 0.0001*IFS_FAA + 0.0001*API_NSS + 0.9673 = FRS_TW6_Status


We also tested regressions between grades in Primary training and the grades in Advanced training, to see if there were later clues to performance in the Advanced phase.� These regressions had much less data to work with because of attrition and the curricular specialization in the later phases.� Table 4 shows the results.� Again, there are interesting negative weights on some factors.� Earlier flight test grades correlated with later flight test grades, but academic grades were inconsistent in their influences.� Note the fits on advanced flight test grades are better than those in the previous table.

4           Design of a Database

An alternative way to store the data is in a traditional database, and this offers more flexibility in running queries on it.� We built a prototype with Oracle XE for Laptops. The SQL Developer interface tool was used to access Oracle and run SQL queries.� After all the data preparation was completed, the final schema was moved (using SQLD) to an Oracle 19c Database at the campus Network Operations Center.� Access the database was over port 1521 as set up by the Network Operations staff.

The main tables needed for a traditional database design are a student table, a curriculum table, a score table, a student-curriculum linking table, and a student-score linking table.� There will be many scores for each student, so there needs to be an auxiliary data structure holding links to the score records for each student.� Additional tables were sent us beyond those mentioned earlier, and


Table 4: Best regressions for later-training grades.

Size of row subset

Average error

Best regression formula found

39

2.328

-0.301*PRI_166A_CH-1_Academics_ RAW_SCORE_DV + 0.423*PRI_166A_CH-2_Academics_ RAW_SCORE_DV - 2.904*PRI_166A_CH-2_GRADE + 89.820 = ADV_ACADEMIC_AV

857

8.636

30.087*PRI_166B_GRADE + 0.166*PRI_166B_Academics_ RAW_SCORE_DV + 37.455 = ADV_ACADEMIC_AV

14

2.157

-19.007*PRI_TW-5_166A_GRADE + 0.032*PRI_TW-5_166A_Academics_ RAW_SCORE_DV + 118.275 = ADV_ACADEMIC_AV

6

-

Insufficient data

63

2.610

49.237*NFO_TW-6_155C_Primary_GRADE + 0.040*NFO_TW-6_155C_Primary_Academics_ RAW_SCORE_DV + 38.292 = ADV_ACADEMIC_AV

443

3.257

8.488*NFO_TW-6_162A_Pri2_GRADE + 0.282*NFO_TW-6_162A_Pri1_ Academics_ RAW_SCORE_DV + 61.117 = ADV_ACADEMIC_AV

870

7.185

17.809*NFO_TW-6_162_Pri1_GRADE + 0.043*NFO_TW-6_162_Pri1_Academics_ RAW_SCORE_DV + 72.201 = ADV_ACADEMIC_AV

16

.00083

0.23217*PRI_166A_CH-1_GRADE + -0.00062*PRI_166A_CH-1_Academics_ RAW_SCORE_DV + 0.80358 = ADV_FLIGHT_AV

650

.00012

-0.07254*PRI_166B_GRADE + 1.24738 = ADV_FLIGHT_AV

64

00000

0.14389*NFO_TW-6_155C_Primary_GRADE + 0.00017*NFO_TW-6_155C_Primary_Academics_ RAW_SCORE_DV + 0.84174 = ADV_FLIGHT_AV

871

.00012

0.29038*NFO_TW-6_162A_Pri1_GRADE + 0.0009*NFO_TW-6_162A_Pri1_Academics_ RAW_SCORE_DV + 0.60225 = ADV_FLIGHT_AV

626

.00007

0.46048*NFO_TW-6_162_Pri1_GRADE - 0.00003*NFO_TW-6_162_Pri2_Academics_ RAW_SCORE_DV + 0.52616 = ADV_FLIGHT_AV


they could also be helpful in database queries.� Examples were the list of curricula and their names, the descriptions of the coded values, and the descriptions of the attribute labels.

Constraints we had to address included:

       Column name length: Database attribute names usually have limits.�

       Non-alphabetic characters in attribute names: Characters that had to be replaced were �-�, �(�, �)� , �.�, and ��/�.

       Values that were spaces: They had to be replaced by nulls.

       Dates and times: Several incompatible formats were regularized as epoch time as described in section 2.

       As described, missing ID_CODE values were replaced with sequential negative numbers.

A problem doing outer joins with the ID_CODE attribute is that its values will occur twice in the result.� The apparent way in SQL would be:

CREATE TABLE T3 AS SELECT * FROM T1 FULL OUTER JOIN T2 ON T1.ID_CODE = T2.ID_CODE

However, the �*� (select all attributes) will confuse the SQL interpreter since the ID_CODE attribute is in both tables. �An option is to rename the ID_CODE attribute to ID_CODE1 in table T1 and ID_CODE2 in table T2. Now to combine the two ID_CODE attributes we had to first create two separate tables followed by DROP COLUMN of ID_CODE2. �Next we created a table T6 with ID_CODE2. Next the attributes ID_CODE1 & ID_CODE2 (in tables T5 & T6) were renamed to ID_CODE (SQLDEVELOPER). �Finally the two tables were merged into one.� This process was repeated for all tables one by one till a FULL OUTER JOIN (of all tables) was generated.

As an example of statistical aggregation, to get an average test score from the ML_ADV_E2_TW_1_176_ACADEMICS table:

select id_code, sum(raw_score_dv) / count(raw_score_dv) as raw_score_dv_avg

group by id_code

order by id_code


The student database was designed with the Student table as the primary table, with primary key the ID_CODE. The full table with the attributes and the datatypes is shown in the entity-relationship diagram (Figure 1).� Student scores are recorded in eight tables: SYLLABUS_PRE, SYLLABUS_ASTB, SYLLABUS_IFS, SYLLABUS_API, SYLLABUS_NFO, SYLLABUS_PRI, �


Figure 1: Schema for a database redesign for the data.


SYLLABUS_INT, and SYLLABUS_ADV.� A line goes from the syllabi tables to the student table to indicate a foreign-key relationship which ensures that there are no extraneous ID_CODE data.� An example query that can calculate gender statistics is:

select gender, count(int_flight_av),

avg( int_flight_av), stddev( int_flight_av )

from student, syllabus_int

where student.id_code = syllabus_int.id_code

group by gender


5           CONCLUSIONS

Our results identified quite a few factors helpful in predictions, some that were obvious and some that were not.� Some factors we measured as significant such as previous flight training, gender, and race are not ones the Navy can control practically or legally.� Overall, we conclude that the Navy is doing a good job predicting performance of candidate candidates from their multistage testing program, but we found some factors that need further consideration.

Future work should definitely try to obtain more complete data on the candidates, as many potentially useful comparisons such as between cumulative metrics such as NMU, RRU, IPC, FPC, and NSS lacked sufficient data for us.� Further work could investigate additional metrics for predicting performance by additional testing; combinations of factors could show new trends.� The approach of combining factors with a set-covering machine-learning algorithm to find the most useful set of factors is promising and should be explored further.

6           Acknowledgements

This work was supported by the U.S. Fleet Forces Command through the Naval Research Program at NPS.� Abram Flores assisted us.� Opinions expressed are those of the authors and do not represent the U.S. Government.

LIST OF REFERENCES

[1]     Ambriz, A. (2017, June).� Database system design and implementation for Marine air-traffic-controller training.� M.S. thesis, Naval Postgraduate School.

[2]     Dubey, R. (2016).� Performance evaluation of military training exercises using data mining.� M.S. thesis, University of Skovde.

[3]     Ebbatson, M., Harris, D., Huddleston, J., and Sears, R. (2012).� Manual flying skill decay.� In De Voogt, A., and D�Olivera, T., (eds.), Mechanisms in the Chain of Safety: Research and Operational Experiences in Aviation Psychology, Farham, UK: Ashgate, pp. 67-80.

[4]     Fogliatto, M., and Anzanello, M. (2011).� Learning curves: The state of the art and research directions.� In Jaben, M. (ed.), Learning Curves: Theory, Models, and Applications, Boca Raton, FL: CRC Press, pp. 3-21.

[5]     Gombolay, M., Jensen, R., and Son, S.-H. (2019, June).� Machine learning techniques for analyzing training behavior in serious gaming.� IEEE Transactions on Games, Vol. 11, No. 2, pp. 109-120.

[6]     Huggins, K. (Ed.) (2018).� Military applications of data analytics.� New York: Auerbach.

[7]     Hunter, D., and Burke, E. (2009).� Predicting aircraft pilot-training success: A meta-analysis of published research.� Intl. Jnl. of Aviation Psychology, Vol. 4, No. 4, pp. 297-313.

[8]     Kaplan, H. (1965).� Prediction of success in Army aviation training.� Technical research report 1152, U.S. Army Personnel Research Office,

[9]     McFarland, M. (2017, May).� Student pilot aptitude as an indicator of success in a part 151 collegiate flight training program.� Ph.D. dissertation, Kent State University College.

[10]  Rowe, N. (2012, December).� Automated trend analysis for Navy-carrier landing attempts.� Proc. Interservice/Industry Training, Simulation, and Education Conference (I/ITSEC), Orlando, FL.

[11]  Rowe, N., and Das, A. (2020, October).� Machine learning for analysis of Naval aviator training, NPS Technical Report NPS-CS-20-002.

[12]  Salas, E., Milham, L., and Bowers, C. (2003).� Training evaluation in the military: Misconceptions, opportunities, and challenges, Military Psychology, Vol. 15, No. 1, pp. 3-16.

[13]  Schendel, J., and Hagman, J. (1991).� Long-term retention of motor skills.� In Training for Performance: Principles of Applied Human Learning, Chichester, UK: Wiley, pp. 53-92.

[14]  Schnell, T., Keller, M., and Poolman, P., 2008.� Quality of training effectiveness assessment (QTEA): A neurophysiologically based method to enhance flight training.� Proc. 27th Digital Avionics Systems Conference, October, pp. 4.D.6-1-4.D.6-13.


 [AB1]Style=Title

 [AB2]Style=Author

 [AB3]Style= Organization

 [AB4]Style=email

 [AB5]Style=email

 [AB6]Style=email

 [AB7]Style=Abstract-Header